


Track all metrics and create alerts. Make your work easier and save time with VirtualMetric’s monitoring solution.
VirtualMetric’s performance counters are in real-time and provide you with full visibility over your servers, virtual machines, and inventory with 1 seconds intervals for real-time counters with less than 500 milliseconds delay. Unlike other competitors, which visualize the monitored data with 30 seconds to 1-minute intervals, we do everything in real-time. React fast in every situation and avoid any performance issues.
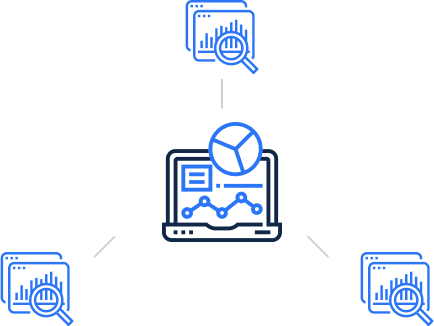
А monitoring and tracking solution for your environment, which is fully customizable and can be fine-tuned according to your needs and organization requirements. VirtualMetric supports a dynamic monitoring dashboard, which you can configure to visualize reports and statistics for the most critical aspects of your infrastructure. Easy management of the dashboards with options to clone them export or import with a single click. Arrange your monitoring suite to visualize the most mission-critical aspects of your infrastructure.
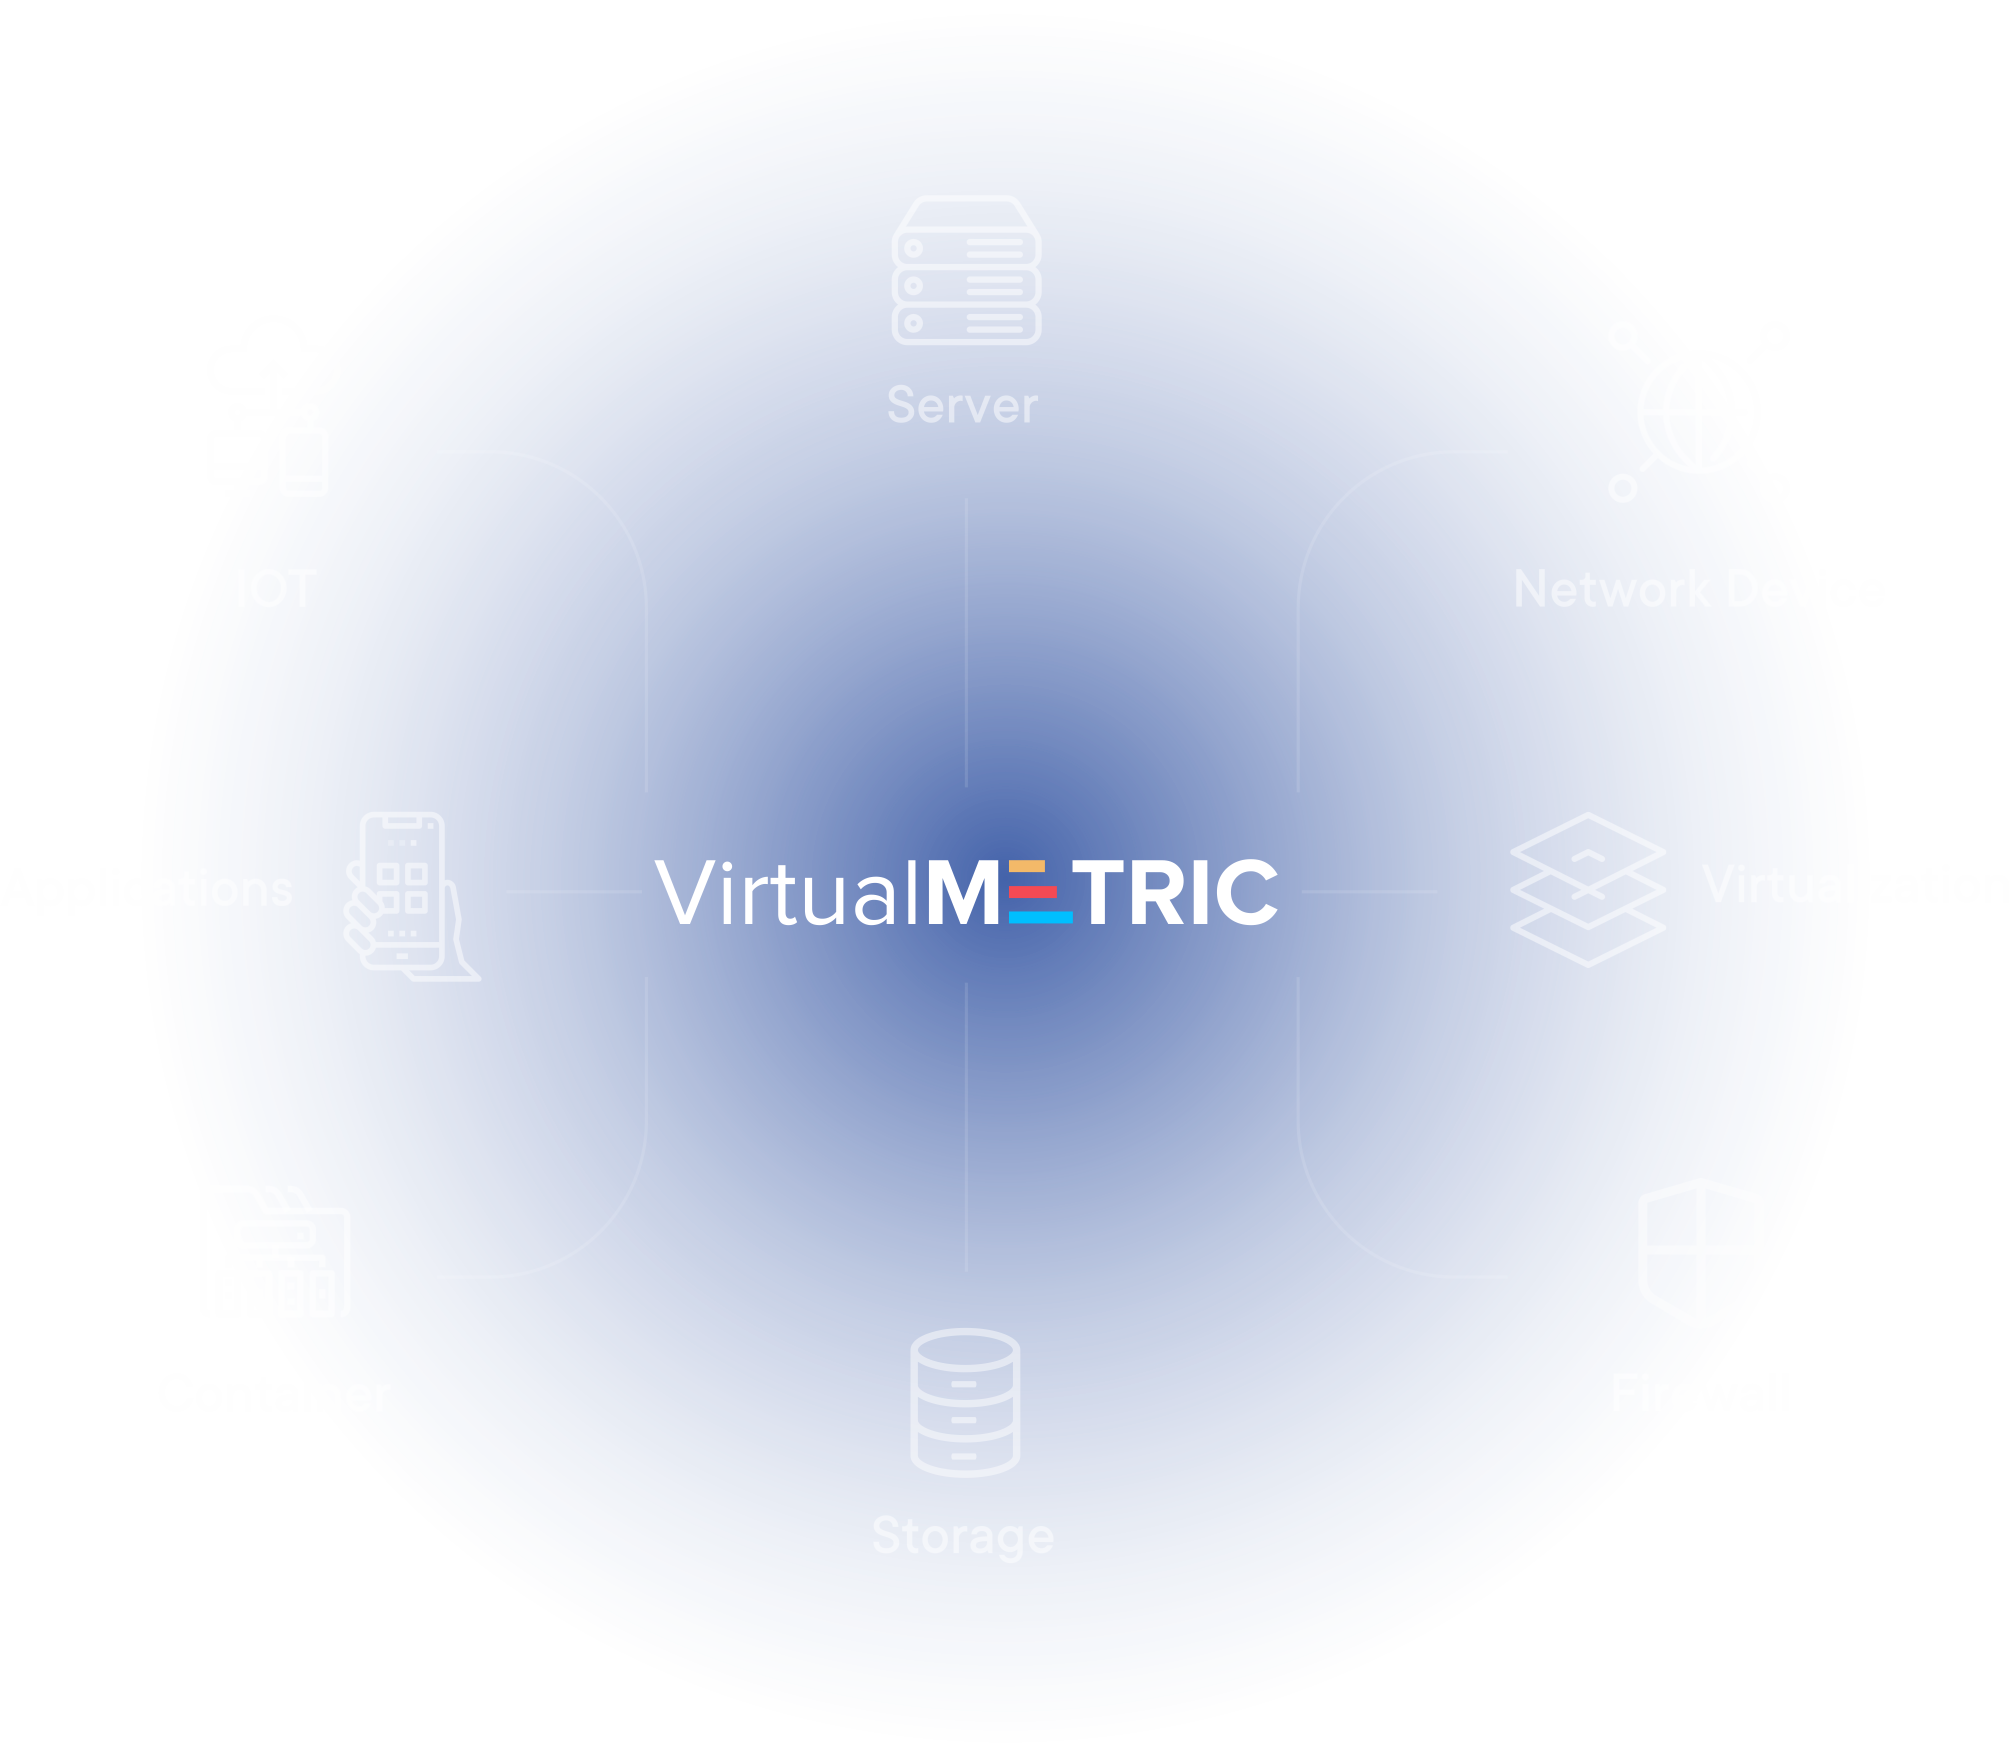
VirtualMetric is an all-in-one monitoring suite that has built-in integrations with all the key technologies to provide in-depth visibility of your infrastructures. Collect metrics and events across your whole IT stack.
Combine performance counters with inventory metrics (CPU, memory, IOPS, reboot needed, Windows defender version, disk usage, etc.) in a single alert. While other products support just basic notifications, VirtualMetric takes you to the next level. Create smart alerts and notifications, to prevent performance issues, attacks or server downtime. Schedule alerts with smart combinations of several criteria. Alarms based on best practices. Be notified for every possible issue, before the users or applications start suffering.
One of the most useful features, which we recommend is VirtualMetric’s Heatmap. It allows you to track the whole infrastructure you manage in only 2-3 seconds.
The Heatmap is a visual representation of the current state of all your hosts, using different colors to show the status of each host: Healthy, Monitor, Warning, Error. You can monitor all performance counters and infrastructure inventory health on a straightforward interface. The heatmap gives you quick information about possible performance and hardware issues in real-time.
VirtualMetric supports a single sign-on solution – a preferred option for all engineers and administrators to authenticate. Use your Active Directory authentication to log in to VirtualMetric’s dashboard and reports. By using an Active Directory authentication to connect the servers, you do not have to type username or password any time you want to get a report or track the inventory changes within your infrastructure. Quite useful functionality providing ease of use for big teams.
With other monitoring solutions, when you add new servers to your environment, you need to manually assign them to groups. This consumes time and some servers can be easily missed. In VirtualMetric, we support an auto-join feature. Whenever you add a new server, based on the specific conditions, the new server will automatically join an existing group and will be instantly monitored and visualized in your server reports. If you monitor only the Windows machines, for example, you will already have a Windows group created. When the OS of a new server equals to Windows, it will join automatically the Windows group. Create fast and easy condition-based groups and save time.
One of the advanced features VirtualMetric supports is scheduled PDF reports, delivered directly to your inbox. Decide what type of report, which server or VM performance metrics covered you want to track. Schedule the report and receive it automatically. A useful functionality if you need the same reports every day or on a weekly basis. Be always prepared for important meetings with the right report in your mailbox.
We discover the entire application stack automatically with our autodiscovery mechanism. There are no manual configurations, syncs, or definitions.
VirtualMetric will discover and collect everything in the infrastructure in minutes.