The key to maximizing revenues and ensuring foolproof security is to actively monitor infrastructure. With virtualization growing increasingly, virtual machine or VM performance monitoring is one of the most crucial parts of infrastructure monitoring. This is because as opposed to a physical server or machine, detecting problems in a VM can be even more challenging.
VirtualMetric’s products are designed to specifically target potential issues with servers and VMs, to help bolster the performance and security of the overall IT infrastructure. It provides tech teams to nip issues in the bud before they get bigger and slow down productivity.
Optimizing Server and VM Performance
VirtualMetric offers dedicated tools for both server (Windows/Linux) and virtualization (Hyper-V/VMware). However, the underlying features of these tools are based on the same principles and strategies. Here’s how you can use these tools to optimize your physical and virtual servers:
Identifying Bottlenecks with CPU Performance
As your infrastructure and manpower grow, so does the use of the servers. That can put a strain on the CPU, as more people and machines require more resources. In other words, the processing power has nearly maxed out. This can create a bottleneck situation, where the slowdown in processing slows down all the other processes.
Server monitoring quickly identifies this bottleneck through constant analysis of the process operations. It can alert you in real-time when the processing of the server is at capacity. Similarly, in virtualization, it can alert teams when VMs are putting a lot of stress on the vCPU by asking for too many resources.
Visual Representation of Changes
No matter how much you plan, you cannot be 100 percent sure about the implications of a change until it’s implemented. VirtualMetric’s server monitoring tools can help track and manage change in the servers with actual graphical representation. It helps identify any issues that may arise due to the changes in the configuration or security of the servers in the early stages.

It can visualize the effect on performance due to the implemented changes, which can help enterprises match the real data with their proposed data. This, in turn, can help managers and tech teams alike in strategizing future changes.
So monitoring can also optimize server performance through effective and cautious change management.
Capacity Planning
If you want to keep your server uptime perfect, you have to pay attention to capacity planning. Similarly, if you don’t want the VM host to go into server overload, you should plan the server capacity according to the VM needs. How do you do that? By monitoring the current usage of the resources in both physical and virtual servers.
This is part of long-term optimization and mitigating potential risks. You can prepare as to how you’ll need to grow your infrastructure with time, as your business grows. You have hard data in terms of graphs and charts to help you devise a solid plan.
Server Uptime Monitoring
The uptime is perhaps the ultimate metric for a quick server health check. If the uptime is good, the server is performing well. If the uptime is not impressive, something’s obviously wrong. It’s as simple as that. However, it’s not quite simple, after all. That’s where monitoring comes in, as it not only points to the lagging uptime but also elaborates on the causes.

Inventory Tracking
Keeping track of your inventory is not just important for optimizing performance but also from the point of view of security. You should have an idea of what servers and devices exist in your IT ecosystem. You can keep a tab on all the assets for Windows, Linux, VMware, and HyperV, whichever you may be using.
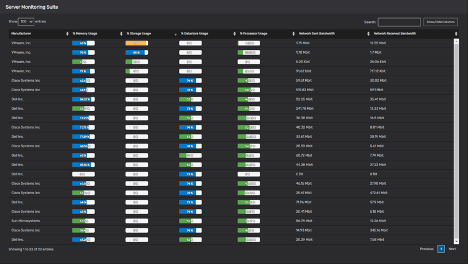
Wide Range of Metrics
One of the most common reasons why enterprises don’t see much improvement even after monitoring their servers and VM architecture is that they are too constraint with the metrics. You can’t just rely on a handful of metrics and call it a day. With VirtualMetric, you get to see all sorts of metrics that basically tell you all the details you should know.
It’s not simply that it presents a wide range of metrics, rather how it presents it. With a single console, you can play around with these metrics to find issues that may escape in oversight sometimes. The tool neatly presents key metrics, which can be digested by tech experts and executives alike, helping streamline both decision-making and operations.
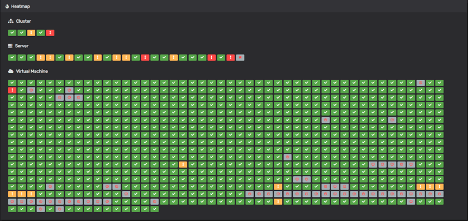
Heatmaps
Perhaps the most important feature you can find on VirtualMetric performance monitoring is heatmaps. Consider heatmaps as a high-level, real-time look at the state of your infrastructure. With just one representation, you can see the issues, both urgent and normal. These heatmaps can help you optimize performance instantly where it’s needed the most.
VM Right-sizing
VM performance monitoring in real-time involves VM right-sizing, which deals with allocating resources where they are required and removing resources where they are not being used. You can identify overloaded or underloaded VMs, and souffle things around to improve the individual performance of VMs. In turn, the hardware is also used efficiently, amongst the different virtual users.
Eliminating Storage Latency
In addition to slow CPU, slow storage can also hinder server performance. By constantly monitoring the read and write operations, the monitoring tool can identify and eliminate latency proactively. It generates smart alerts with details about such performance issues. As a result, monitoring teams can take swift action to improve the input/output speeds.
Conclusion
Monitoring tools are built on the foundation of improving performance and detecting problems before they get big. VirtualMetric takes those foundations to the next level by implementing modern features that make it easy to achieve those purposes. It’s server and VM performance monitoring tools are equipped with many features tailored to growing infrastructures.
On top of that, they offer a dynamic and convenient dashboard that can be customized according to the IT culture of the enterprise. That way, you do things your way, which in turn, pushes efficiency even more so.
Leave a Reply