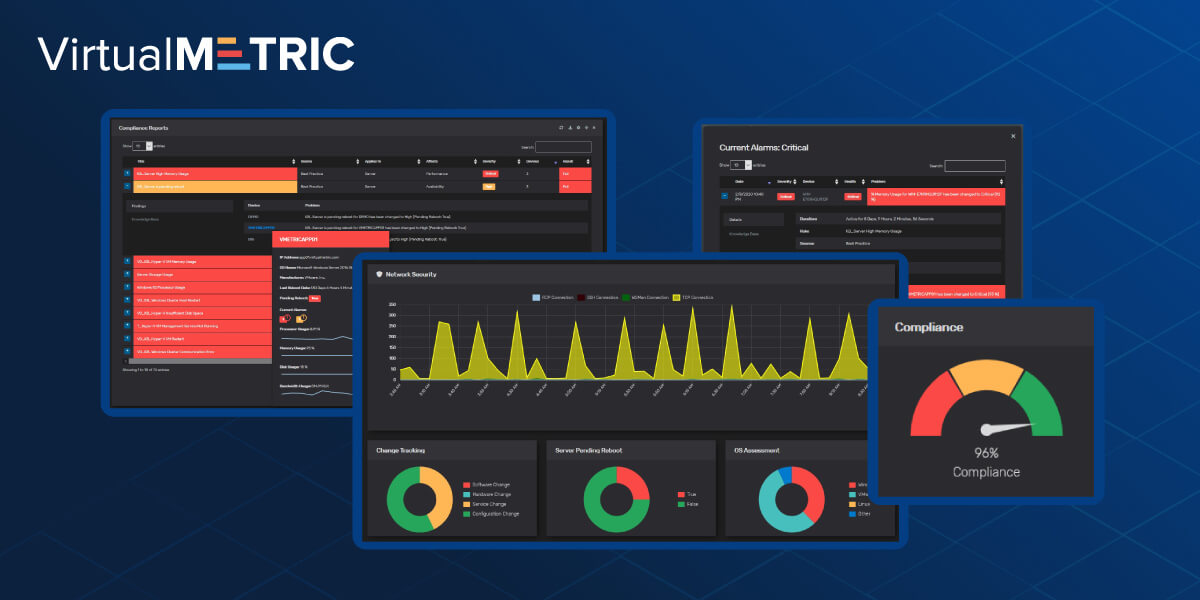
VirtualMetric presents a huge set of new features and improvements on its monitoring Dashboard. During the last months, we have worked hard to implement advanced capabilities and some of the features requests we received from our users. The Dashboard improvements bring you great interactivity and unmatched ease of use. Now you can enjoy Smart Alarms Functionality, Active Alarms, automated Compliance Analysis, additional layers of information and many more improvements. Enjoy proactive issue resolution and easy drill down on any aspect of your infrastructure.
IT and infrastructure are the most rapidly changing areas of today’s life. Just a few years ago we were talking for TBs of data and bare metal servers. Today we discuss PBs of data, complex virtualizations, containers, Big Data, and virtualized workloads. Behind every company stays some kind of infrastructure. To manage it, you need to have a 360 degrees visibility over it and constantly to monitor its work and processes in it. A smart infrastructure monitoring solution is not a matter of choice, but a must for every company. And the monitoring solution needs to evolve at the same pace, with which infrastructure complexity is growing. In VirtualMetric we have the vision that the three most important criteria when you select your monitoring suite should be:
- Enterprise set of features
- Ease of use
- Product development and enhancements
For this reason, we put a lot of development hours in constantly improving our monitoring suite, adding new features, completing features requests from customers and delivering dashboard improvements.
Soon, we will announce several additional products as part of our monitoring suite. But now, we will present to you all the latest dashboard improvements, which we deployed on production in the last months. The improvements on VirtualMetric’s dashboard will provide you with better visibility over your infrastructure, better control, more tools for analysis and easy issue resolution.
Smart Alarms Functionality
To track all the processes, hardware and network components on your infrastructure are impossible. And we all know that high availability and reliability are critical tasks for every Infrastructure Manager or Head of IT department. VirtualMetric provides one of the most comprehensive Alarms Features in the monitoring domain. An Alarm on VirtualMetric goes on when a certain condition on your infrastructure is met or an event with high enough severity occurs. The Alarm comes as a response to one on more critical events or predefined rules you have set up in your monitoring account. When there is something down on your environment, you can track easily errors and warnings and investigate what is the reason for the failure.
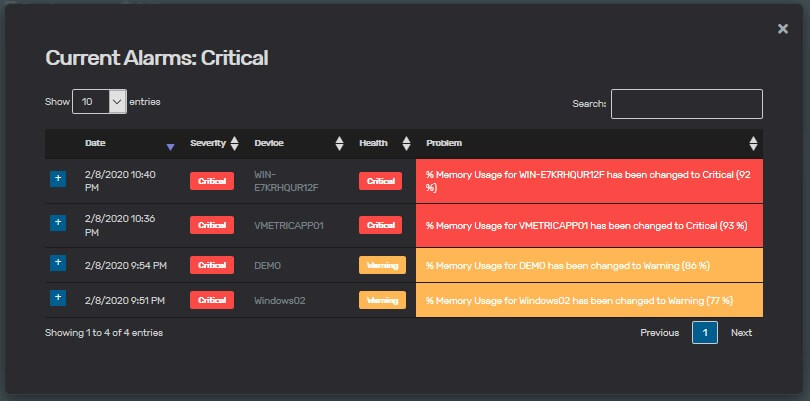
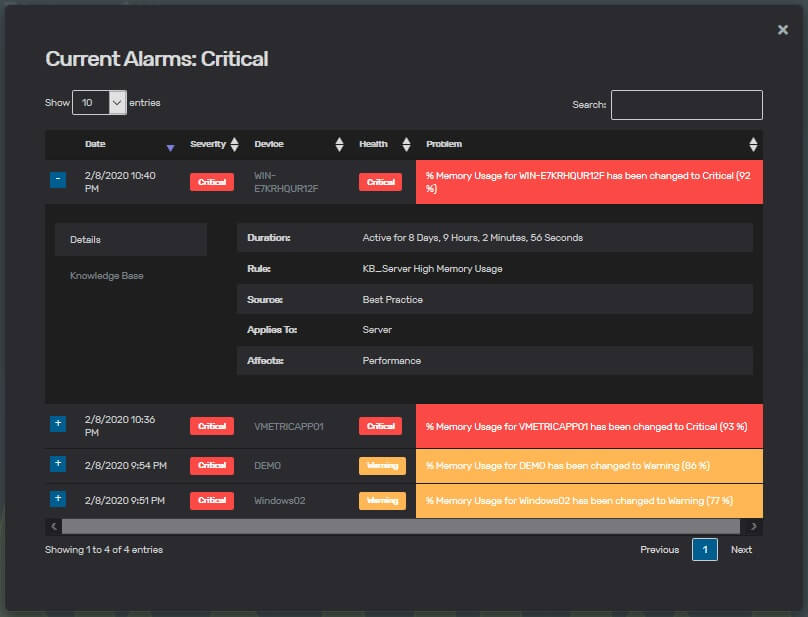
In the alarms section, there are two indicators, which you need to track – Alarm Severity and Alarm Health. The Severity shows what is the impact the specific event has on your environment. Something might be warning for example, but it can have a critical severity on your environment and needs to be resolved immediately. The Health, on the other hand, tracks the status of the specific issue (Alarm) – whether it is just a warning, or it is critical and requires your immediate reaction.
Every Alarm provides an in-depth overview of the issue, reasons for the Alarm activation and delivers the information, which will help you to resolve the issue:
- Duration – frow how much time the Alarm is active.
- Rule – what is the rule, which activated the Alarm and the problem, you need to resolve.
- Source – Describes the nature of the problem.
- Applies to – To which parts of your infrastructure the Alarm applies.
- Affects – How it affects your infrastructure.
- Knowledgebase – Practical help to investigate the issue and area for personalized notes and the creation of internal Knowledgebase.
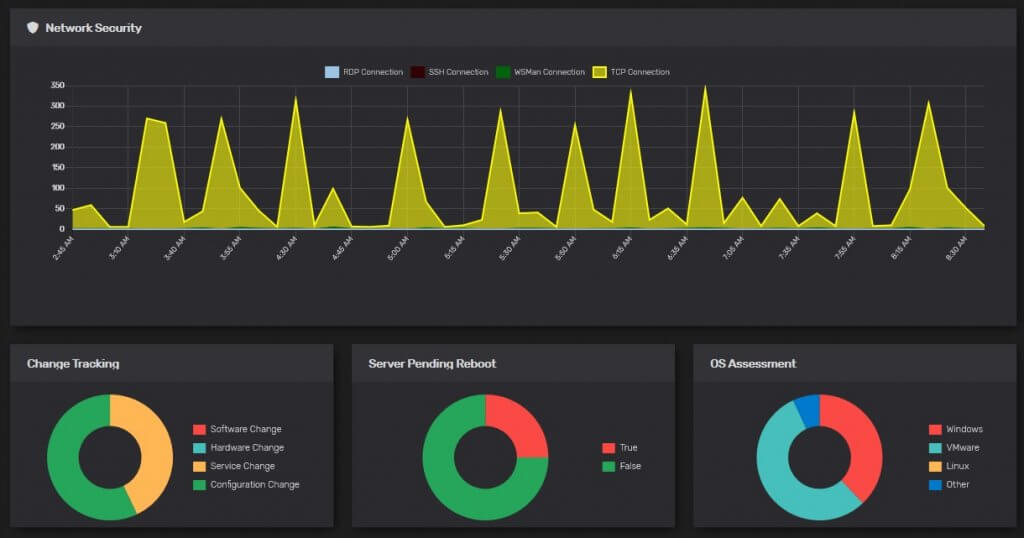
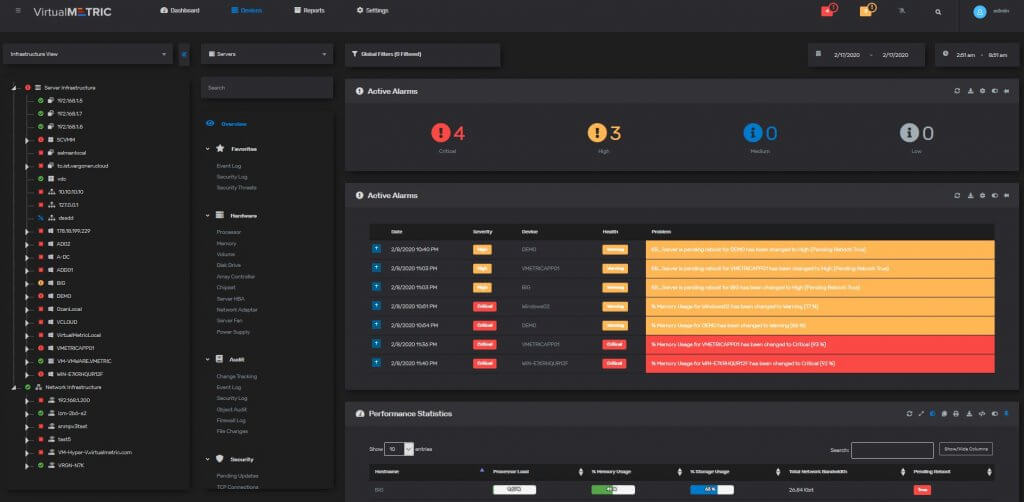
As part of the VirtualMetric Monitoring Suite, now you can benefit from a whole Active Alarms Dashboard. This Dashboard is specifically designed for engineers, who need to ensure high availability of their infrastructure and constant availability of the workloads running on it. Based on the existing rules and alarms, you can create different types of charts. On the Active Alarms Dashboard, you can see the latest alarms, statistics, rules statistics, compliances.
Active Alarms and Compliance Dashboard
The new addition to our features is Compliances. Compliances provide intelligent automated checks of your infrastructure against Best Practices, Security Standards, HCL and more. With it you enable proactive troubleshooting and automate your data center/infrastructure security and audit compliance. You might create different rules for your environment. Instead of showing only single errors, the Compliance features show a set of rules for your infrastructure. If there is an error in only one of them, the compliance result is Fail. If there is no error, you will see a Pass result and be sure your environment is compliant. The feature decreases the time to resolution, hardens your security, ensures your IT environment follows the Best Practices and helps you to avoid downtime or security breaches.
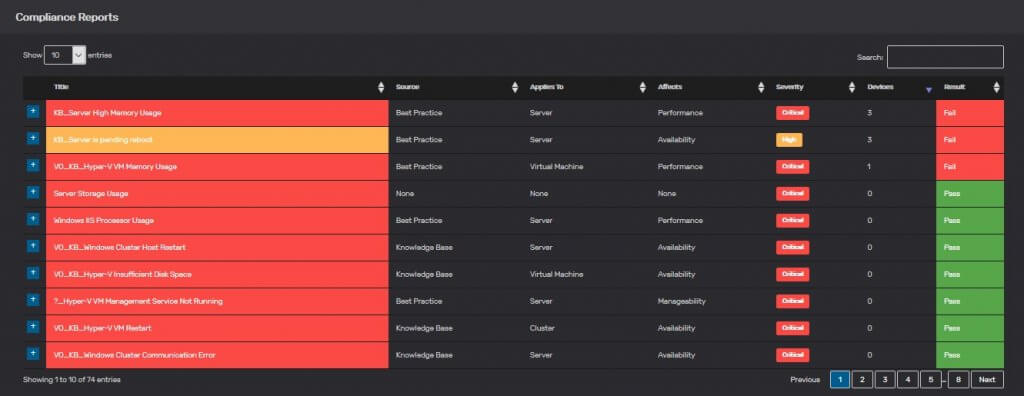
The Compliance feature has multi-stack support and is available for VMware, HyperV, Linux environment, etc.
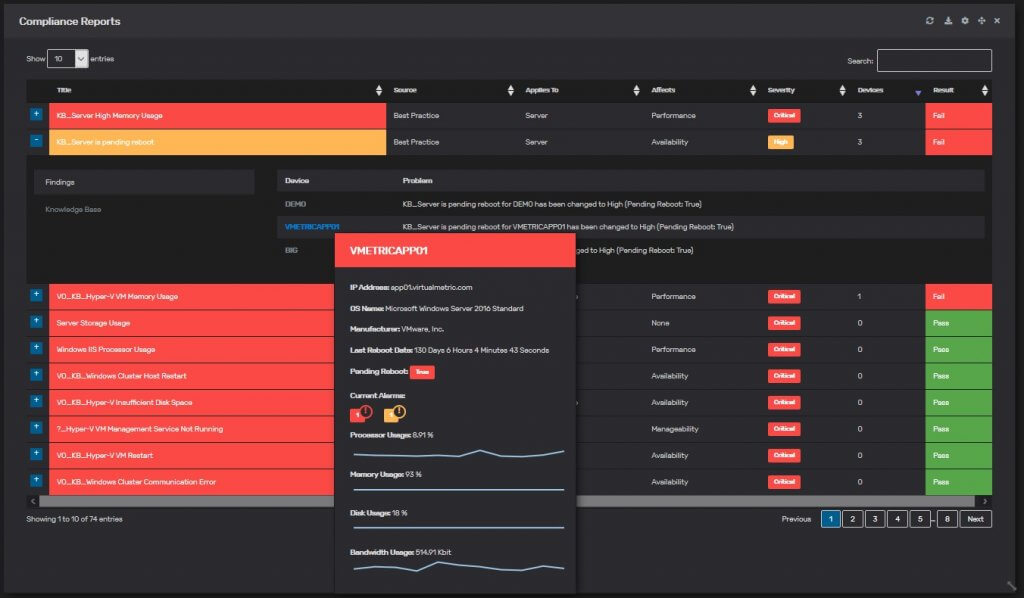
In-depth Details and Full Information for Easy Issue resolution
With its new version, VirtualMetric’s Monitoring Dashboard ads additional layers of visibility on every screen, chart, report and statistics in the product. Now you do not need to switch between screens and reports. You have all of the information just one click away to easily drill down any problem.
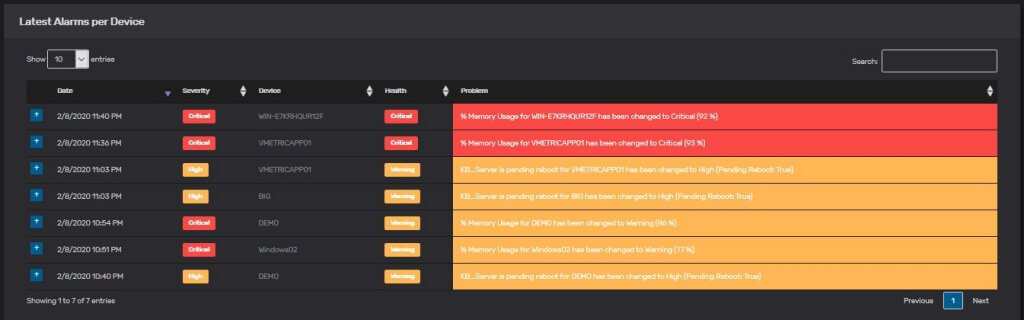
Improved Devices Section
With the latest version of VirtualMetric, you will get an improved devices section. Within it, we have implemented a recursive alarming system and you can easily detect alarms within your hardware, storage, virtual, and networking devices. You can detect with a single view which devices have problems, which are in maintenance mode, which are switched on and which of them need your immediate attention. Based on the device section you can create different reports
New Features on the Dashboard Playlists
We added some handy new features on the Dashboard Playlists, which will make your work easier. You can enjoy Dashboards in full-screen mode, auto-scroll capabilities, useful keyboard combinations and an additional layer of information implemented to the Dashboard playlists also.
Claim Your Free Trial
Do you want to experience all these features? Claim a free trial of VirtualMetric for 30 days and discover all the benefits an advanced monitoring suite can bring to you!
Leave a Reply