If we look at server definition, it is a piece of computer software or hardware that provides functionality to other devices or programs called clients. System administrators often come up with a common question over the performance of a server – Why is my server down?
If server monitoring and management are inefficient, it often makes it very difficult to correctly analyze complex and unpredictable information in a data center. It’s hard to find a reason for server outage. This is when it is important to have a useful server monitoring tool.
Still, the actual challenge lies in selecting an appropriate server monitoring service that monitors the correct performance indicators. In other words, it is very important to understand the requirements first, since your monitoring needs may be different depending upon the applications running on your servers.
Important Metrics to Monitor
Let us have a look at some metrics that are important to monitor in order to keep your servers controlled.
Server Uptime Monitoring
Server uptime refers to the availability and reliability of your servers. This metric checks that your servers are always up and running. Though it’s not necessary to monitor server uptime every minute, it is still important to find out as soon as your server is down. Server uptime of less than 95% indicates a problem. 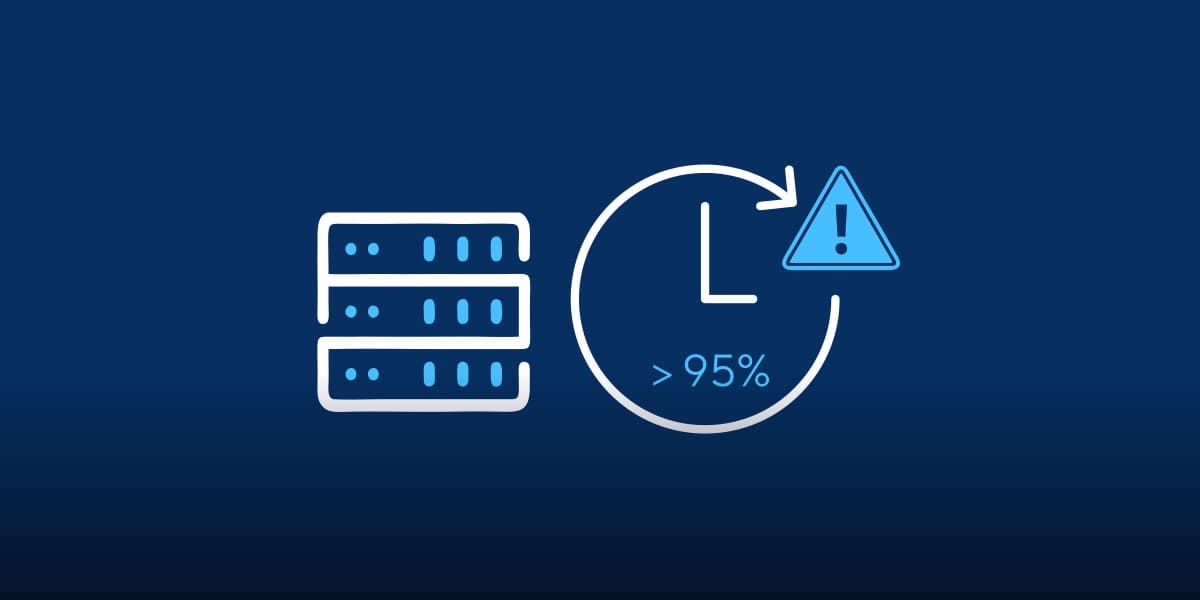
System-Level Performance Metrics
System-level metrics such as memory, CPU, network activity and disk usage are immediate concerns whenever a performance degradation is identified in a data center. By checking these metrics, you can detect the servers that have insufficient RAM, high CPU utilization, limited space in hard drive, or bandwidth issues.
If your system’s physical components are struggling, all tasks related to it will also experience performance issues. By getting a complete access to system-level metric, it becomes much easier to identify and correct issues in server performance or replace any erroneous elements in the system.
Application-Level Performance Metrics
Your servers run application that has numerous services. It’s difficult to understand intra-service dependencies and connection patterns. Monitoring every process and server that runs on the server can help you identify which process or service is having an impact on server performance. You can also analyze server load along with managing system resources.
 Security-Level Performance Metrics
We all know how server works. All servers have too many tasks running in the background, and it can become very difficult to find out what is being modified or written to or from your files. If you monitor for any such changes, it can save you a lot of time.
For instance, unauthorized access, if not detected, can cause data breach and result in loss of sensitive data. Hence, it’s important to know when the files are modified, content was changed or any specific resources were accessed. This monitoring can also help in intrusion detection and ensure the security of your infrastructure.
Requests Per Second
A web server primarily receives and processes requests. However, if it gets overloaded with requests, its performance can deteriorate. RPS metric computes number of requests that are received during a particular monitoring period, which is often a range of one to five minutes. RPS does not consider the nature of request and counts every request.
 Request Per Second evaluation is an important metric as it provides a clear insight on how many requests your server is able to handle before a potential problem arises. It can also be helpful in cases where a web application’s overall performance is generally slow.
Error Rates
Error rate is an important metric that allows you to calculate the percentage of requests that do not receive a response. By tracking HTTP server errors, we get an insight of potential problems or application malfunctions. This allows your DevOps team to efficiently analyze and repair errors.
During times when the server experiences big load, it is very likely for errors to occur. Hence, it’s imperative to set up alerts for HTTP 5xx codes in order to identify and minimize issues before they can increase and have a negative impact on the application’s overall health.
Thread Count
A thread count can track your total requests received at a particular point of time, hence allowing you to assess your server load. Many servers are mostly set up to limit number of threads per process. When this thread count crosses maximum threshold, the requests are kept on hold till more space is available.
 If processing requests takes a long time, it can lead to timeout of the request. Subsequently, thread count metric provides a good indication and insight into your server’s performance since if your application is producing too many threads, it is likely that your error rate increases.
Average Response Time (ART)
Average Response Time calculates the length of response/request cycles. Hence, you can evaluate average amount of time taken by the application for generating response from a server. Average Response Time ensures that that the application performs at adequate speed to result in positive user experience.
Because Average Response Time gives an average of every request cycle over a particular period of time, it can be impacted negatively by a slow component or any unusual circumstances. This may lead the system to show a slower performance than what it actually is.
Peak Response Times
To get an accurate measure of response time, the most effective way is to get both peak response time and average response time metrics. Peak Response Time evaluates the length of request per response cycle for tracking the longest cycle during the server monitoring period.
If your Average Response Time metric value is less than one second, but the Peak Response Time is higher, it means that one of those requests took more time. This could be an anomaly. If both PRT and ART are high, it is most likely that your server has a problem.
 Whereas Average Response Time is a general view of the overall performance of the server, Peak Response Time helps you identify the problematic resources. It also gives an indication of where the root cause of an issue lies. Hence, both metrics together are important to accurately measure a server’s response time.
VirtualMetric’s Server Monitoring Solution
VirtualMetric provides real-time agentless server monitoring software with full visibility over your virtual and physical servers. To find out more about our services get a free trial here.
Leave a Reply