Discover VirtualMetric

VirtualMetric Dashboard 2020: Unmatched Levels of Interactivity and Wide Set of New Features

No comments

VirtualMetric presents a huge set of new features and improvements on its monitoring Dashboard. During the last months, we have worked hard to implement advanced capabilities and some of the features requests we received from our users. The Dashboard improvements bring you great interactivity and unmatched ease of use. Now you can enjoy Smart Alarms Functionality, Active Alarms, automated Compliance Analysis, additional layers of information and many more improvements. Enjoy proactive issue resolution and easy drill down on any aspect of your infrastructure. 

vmetricBlogVirtualMetric Dashboard 2020: Unmatched Levels of Interactivity and Wide Set of New Features
read more

VirtualMetric Exhibiting at Microsoft TechDays Helsinki

No comments

Save the date and meet VirtualMetric at Microsoft Tech Days Helsinki. On the 28th of February and 1st of March we will join the two-day Microsoft community event and present VirtualMetric’s advanced monitoring capabilities. Join VirtualMetric’s Team, some of the world’s top speakers and the best opportunity of the year for skills development and trendspotting. Expand and deepen your knowledge in Microsoft’s products and solutions and discover how VirtulMetric monitoring suite can help you.

vmetricBlogVirtualMetric Exhibiting at Microsoft TechDays Helsinki
read more

Performance Monitoring with Smart Alerts and Query-Based Notifications by VirtualMetric

No comments

Managing hundreds of servers and thousands of hosts can be a hard task. You need to hold everything under control and be sure your environment is working smooth and without interruptions. Running a complex IT environment is connected with a constant monitoring of a lot of components – physical servers, CPU, RAM, IOPS, backups, storage, networking, etc. In such a situation, even the most complex dashboard or advanced monitoring solution cannot guarantee that all the components are 100% healthy and work efficiently. The reason for this is that if something happens, your infrastructure needs your skillful administrators and engineers to take immediate actions.

VirtualMetric is introducing Smart Alerts and Query-based Notifications. With our smart Alerts and Notifications, you will be notified in case of an issue within your infrastructure occurs, a component is not working as expected or there is a threat to the system.  The Smart Notifications and Query-based Alarms are an advanced tool, tailored for the sophisticated needs of cloud engineers managing enterprise infrastructure. The intelligent server alerting system is designed to improve the availability and to reduce the time-to-resolution of a problem within your company.

vmetricBlogPerformance Monitoring with Smart Alerts and Query-Based Notifications by VirtualMetric
read more

Dashboard Playlists – Full visibility over your infrastructure

No comments

VirtualMetric Real-time Monitoring Suite is now supporting Dashboard Playlists, providing full visibility over your infrastructure and virtualization monitoring for your whole team. Monitoring a complex infrastructure is a hard task. We make it simple thanks to our new Dashboard and a bunch of functionalities focused on your user experience, time-saving and improving the efficiency of your team.

The key to taking all the benefits from a monitoring solution for your physical and virtual environment is having a full-featured solution, which provides also a great UX and ease of use. By avoiding the complexity you will be able to find the information you need in a second, react fast to unexpected situations and solve all issues before they emerge.

vmetricBlogDashboard Playlists – Full visibility over your infrastructure
read more

New Tool – VirtualMetric Log Analyzer

No comments

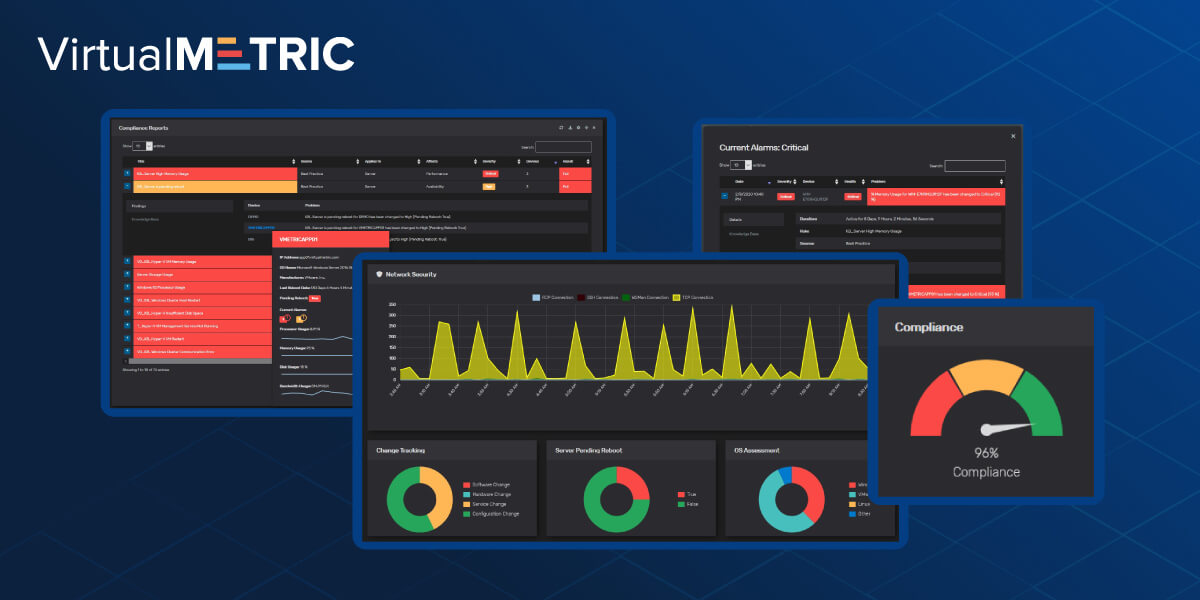
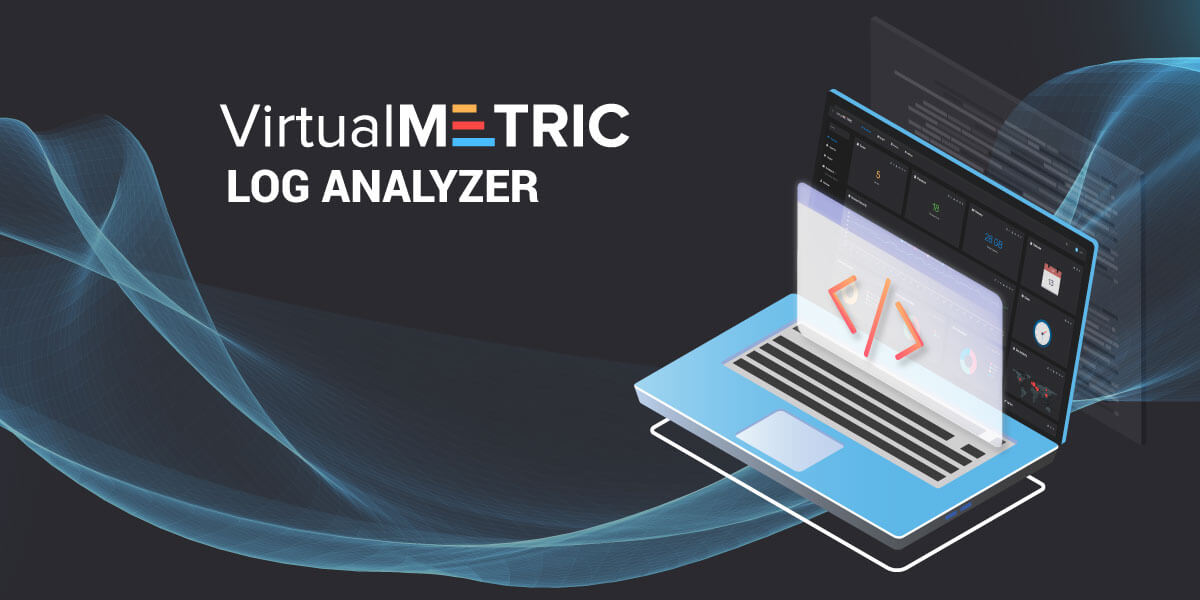
VirtualMetric is happy to announce the latest feature we added to our real-time infrastructure monitoring suite – Log Analyser – Log Analysis and Log Monitoring tool. Nowadays, every event inside your infrastructure must be logged – either due to the requirements of your own business or due to security and compliance requirements. System engineers want to know everything happening within their servers, virtual machines, virtualization, and applications, but this result in having tons of data to analyze. Managing and understanding the logs manually if you are a small organization can be acceptable. But for enterprises, banks, financial organizations, SaaS providers, governments or global corporations, a log analysis and log monitoring tool is the key for fast troubleshooting and Security Information and Event Management (SIEM) compliance.

More and more enterprises are facing outages and bunch of security threats. In the world of virtualization and cloud, having a monitoring solution is essential to keep your environment healthy. In case of attack, outage, low performance or infrastructure issues, analyzing the logs is the first step to understand the source of the problem, verify events and find the reason for the unusual system behavior. VirtualMetric Log Analyzer is one of the must-have features for the advanced monitoring of your environment. The reason for this is that thanks to the Log Analyzer, you can make data and event correlation at that point in time, in which the problem occurred.  Monitoring the logs and logs analysis is the key for any IT team to identify misconfigurations, unwanted changes, intrusion attempts or low system performance. By the use of the log analyzer, you ensure the smooth work of your infrastructure and application and improve the customers’ satisfaction, increase the revenue, strengthen the security against attack.

vmetricBlogNew Tool – VirtualMetric Log Analyzer
read more