VirtualMetric is happy to announce the latest feature we added to our real-time infrastructure monitoring suite – Log Analyser – Log Analysis and Log Monitoring tool. Nowadays, every event inside your infrastructure must be logged – either due to the requirements of your own business or due to security and compliance requirements. System engineers want to know everything happening within their servers, virtual machines, virtualization, and applications, but this result in having tons of data to analyze. Managing and understanding the logs manually if you are a small organization can be acceptable. But for enterprises, banks, financial organizations, SaaS providers, governments or global corporations, a log analysis and log monitoring tool is the key for fast troubleshooting and Security Information and Event Management (SIEM) compliance.
More and more enterprises are facing outages and bunch of security threats. In the world of virtualization and cloud, having a monitoring solution is essential to keep your environment healthy. In case of attack, outage, low performance or infrastructure issues, analyzing the logs is the first step to understand the source of the problem, verify events and find the reason for the unusual system behavior. VirtualMetric Log Analyzer is one of the must-have features for the advanced monitoring of your environment. The reason for this is that thanks to the Log Analyzer, you can make data and event correlation at that point in time, in which the problem occurred. Monitoring the logs and logs analysis is the key for any IT team to identify misconfigurations, unwanted changes, intrusion attempts or low system performance. By the use of the log analyzer, you ensure the smooth work of your infrastructure and application and improve the customers’ satisfaction, increase the revenue, strengthen the security against attack.
What type of logs is VirtualMetric collecting for exceptional Log Analysis and Log Monitoring?
VirtualMetric is collecting and analyzing logs from heterogeneous sources and presenting them on a user-friendly dashboard. We collect logs for your inventory, host information, processes, services, event logs, security logs, firewall logs, TCP connections, critical system logs and many more. VirtualMetric will provide you with information for all the logs from your switches, firewalls, servers, databases, and users. We collect a comprehensive centralized log collection to help you in conducting an effective root cause analysis. The solution offers an agentless log collection, which makes it compliant with all security requirements and easy to use.
All the logs from your environment are collected and presented in a chart view making it easy for you to troubleshoot and help you understand better the processes within your infrastructure. Perform a fast analysis on the system behavior and performance, without the need to spend days in going manually through all the logs or writing complex queries. Meet your business objectives with a simple and easy to use solution.
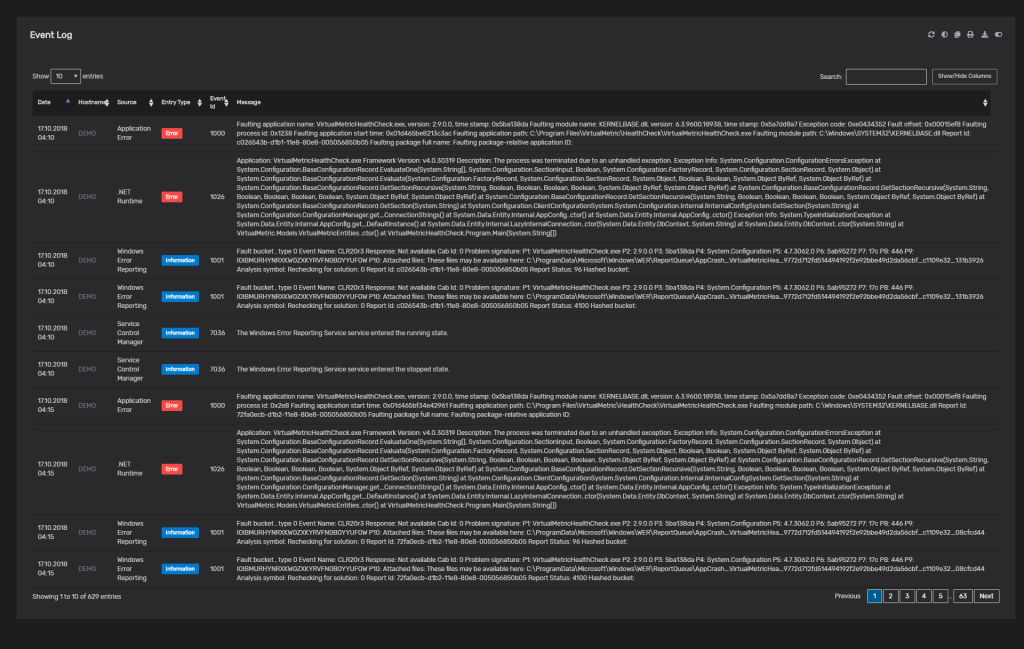
The typical Event Log Data Table – time-consuming and hard to analyze
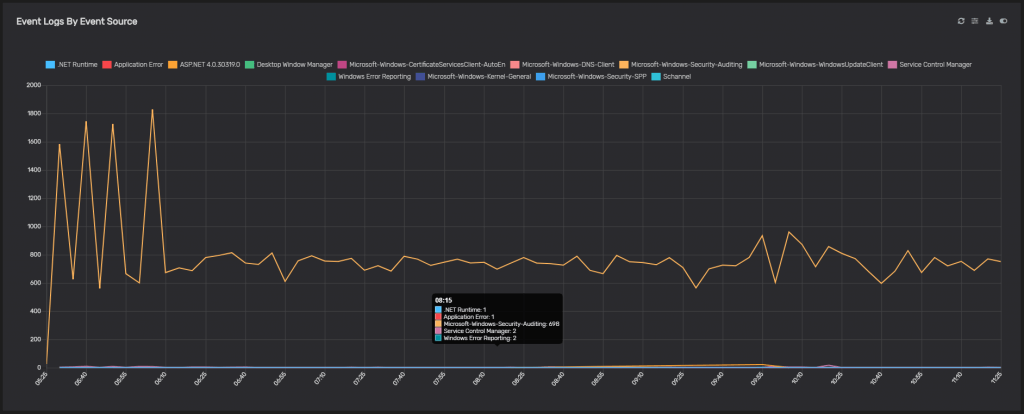
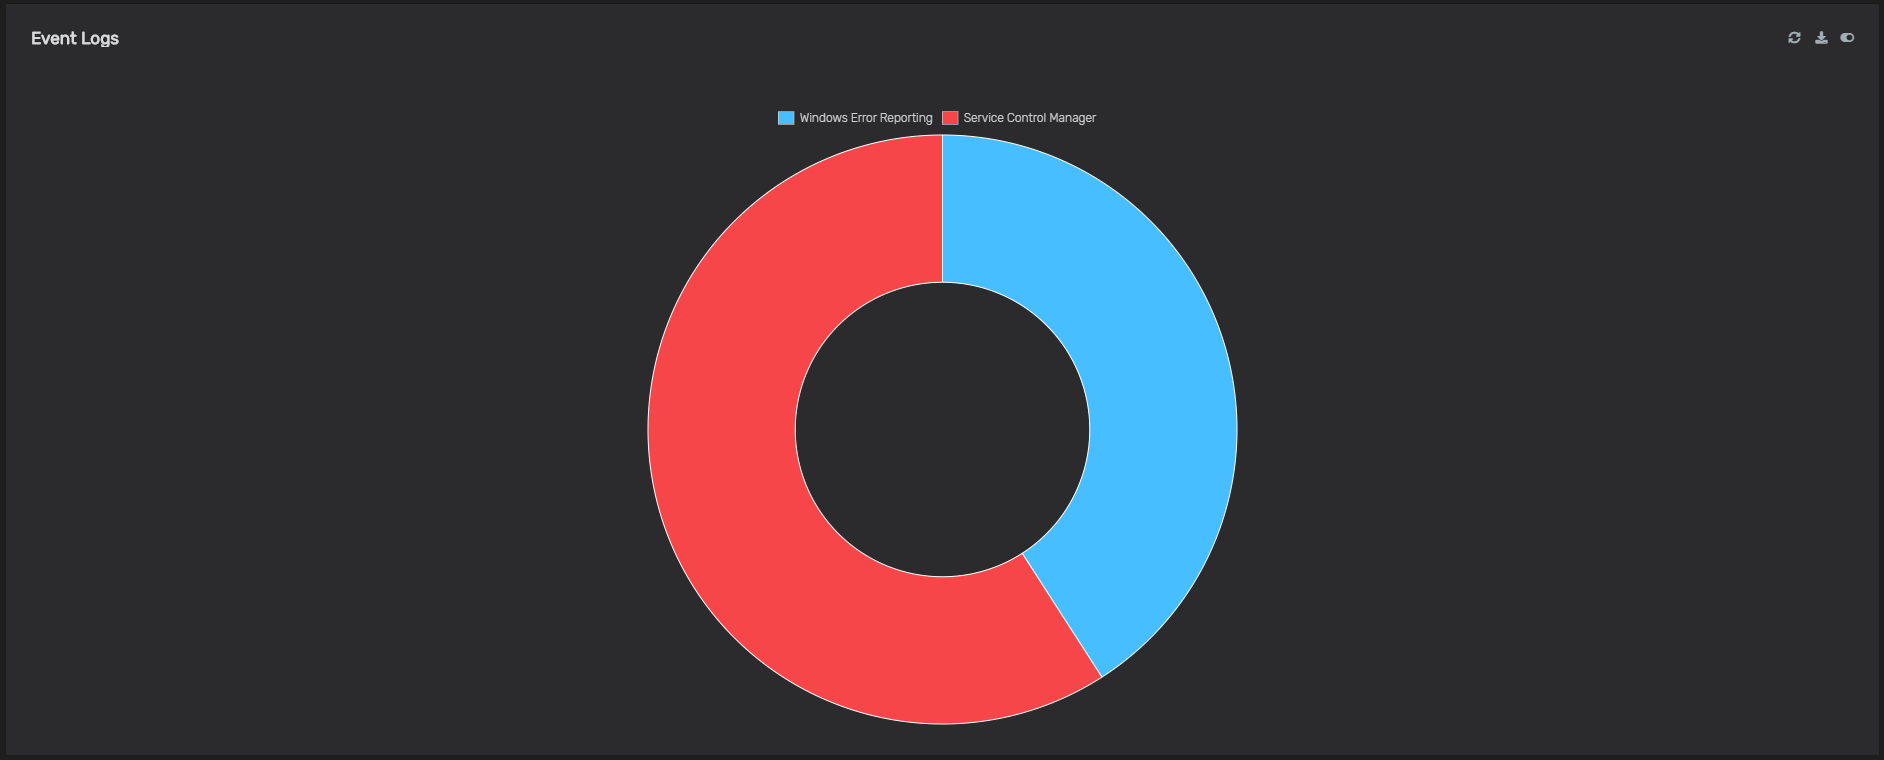
Event Logs by Event Source – a beautiful visualization of the logs by the event source
Real-time event log correlation
VirtualMetric Log Analyzer is helping you to mitigate security threats effectively by correlating event log data in real-time. Detect malicious traffic, unusual behavior and protect the mission-critical business apps. Audit critical changes based on their log time. Discover the log correlation and fix every issue just on time.

Event Logs by Server
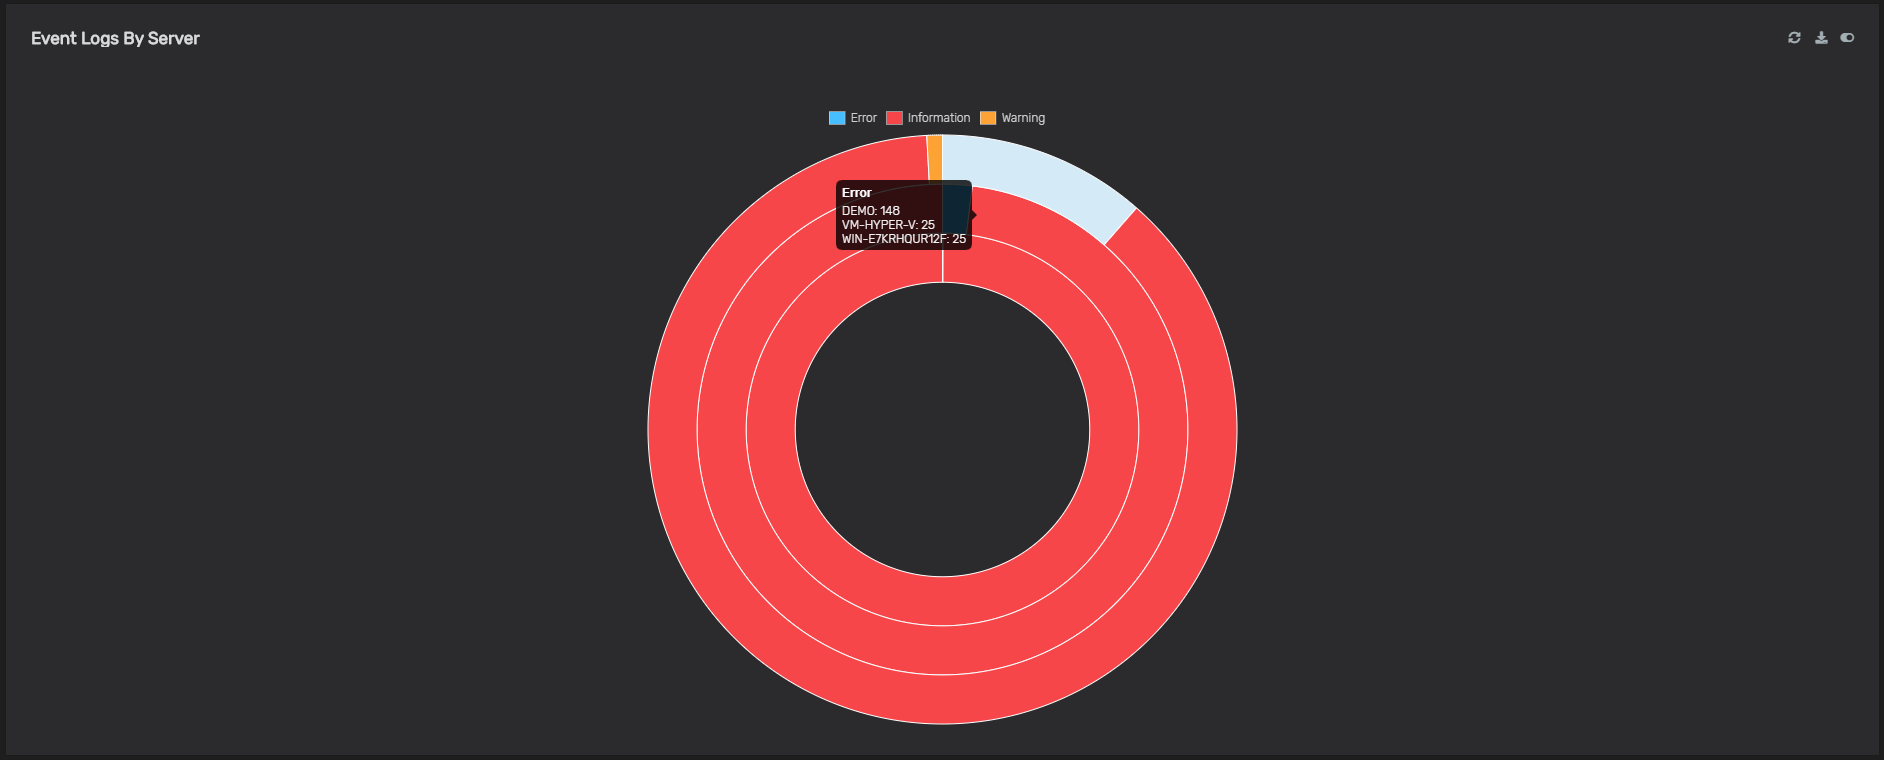
Event Logs by Server - Doughnut Chart

Event logs by server top entry type
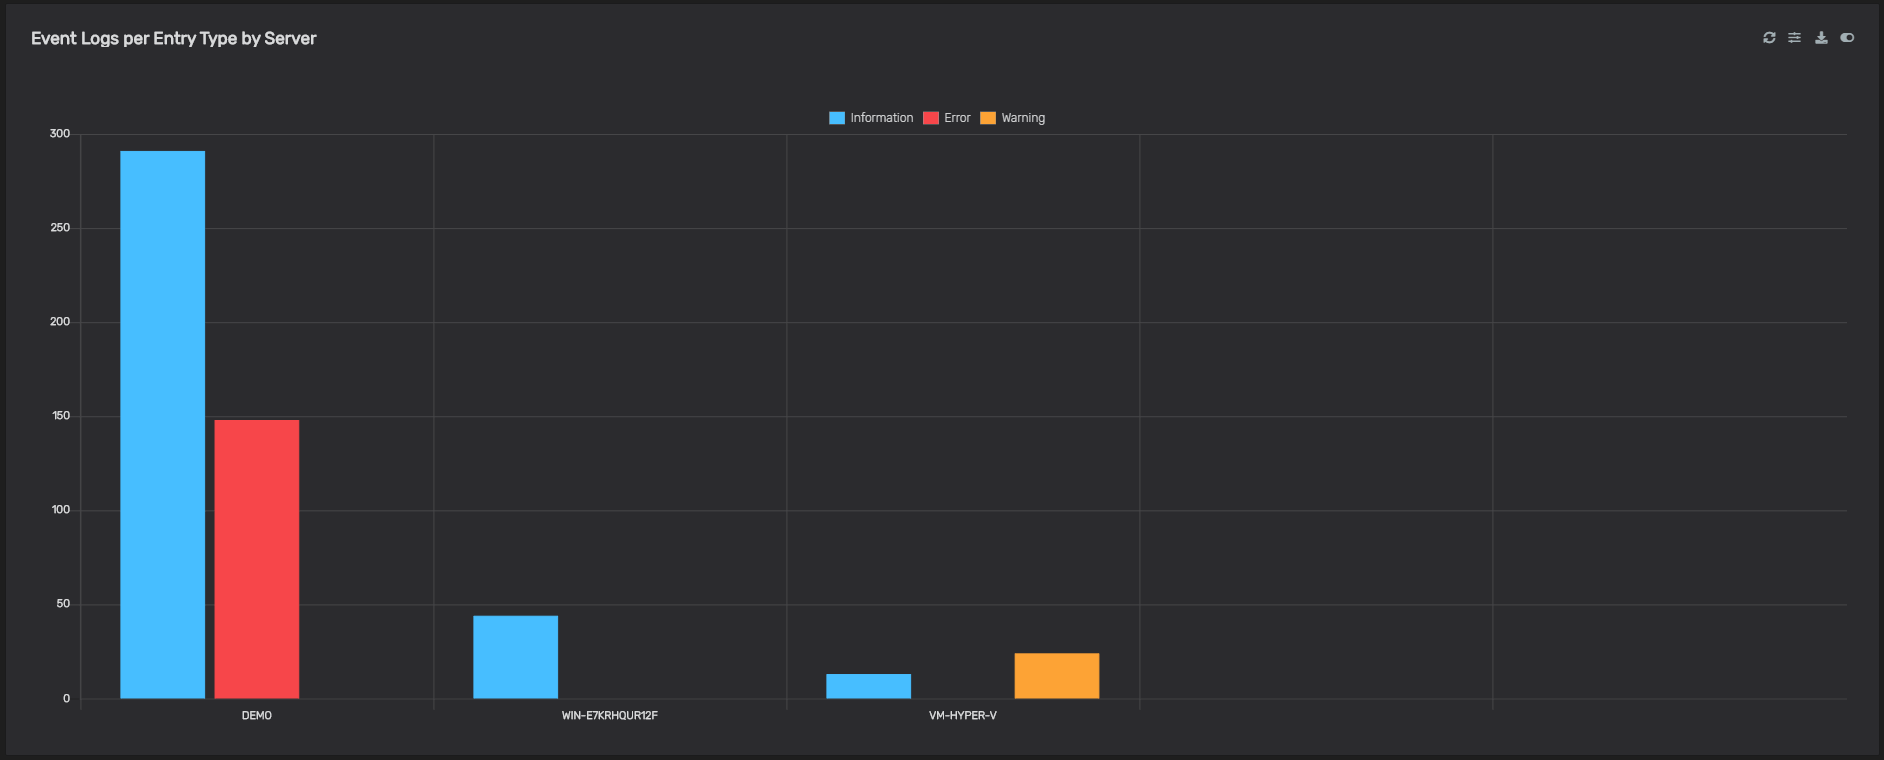
Еvent logs by server top entry type - filtered by usage
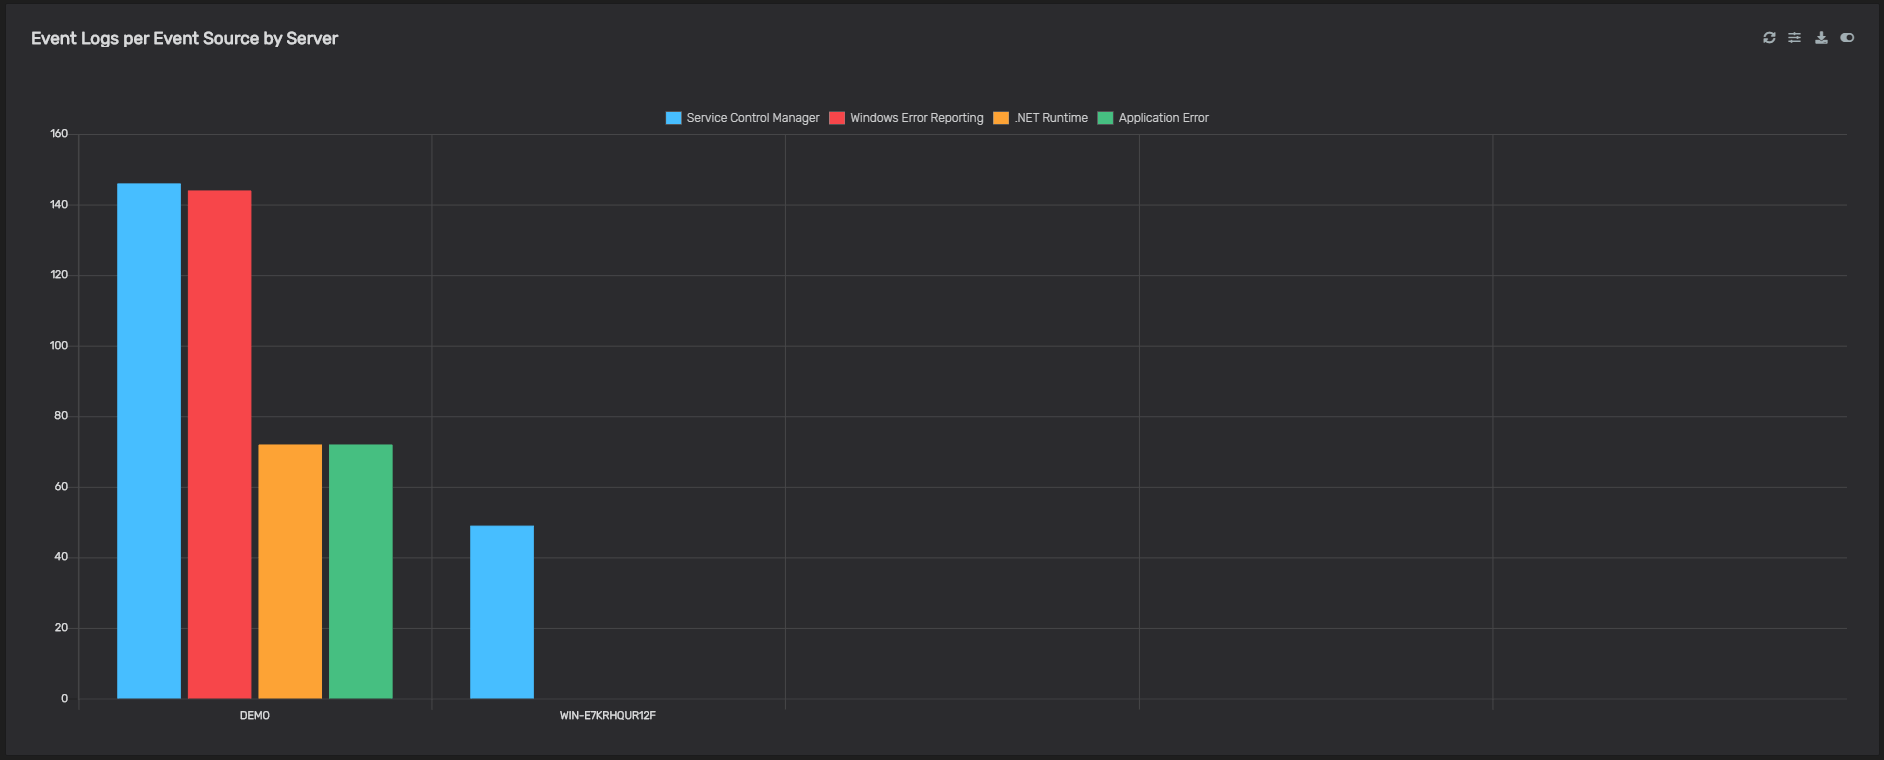
Event logs by server- Top source usage
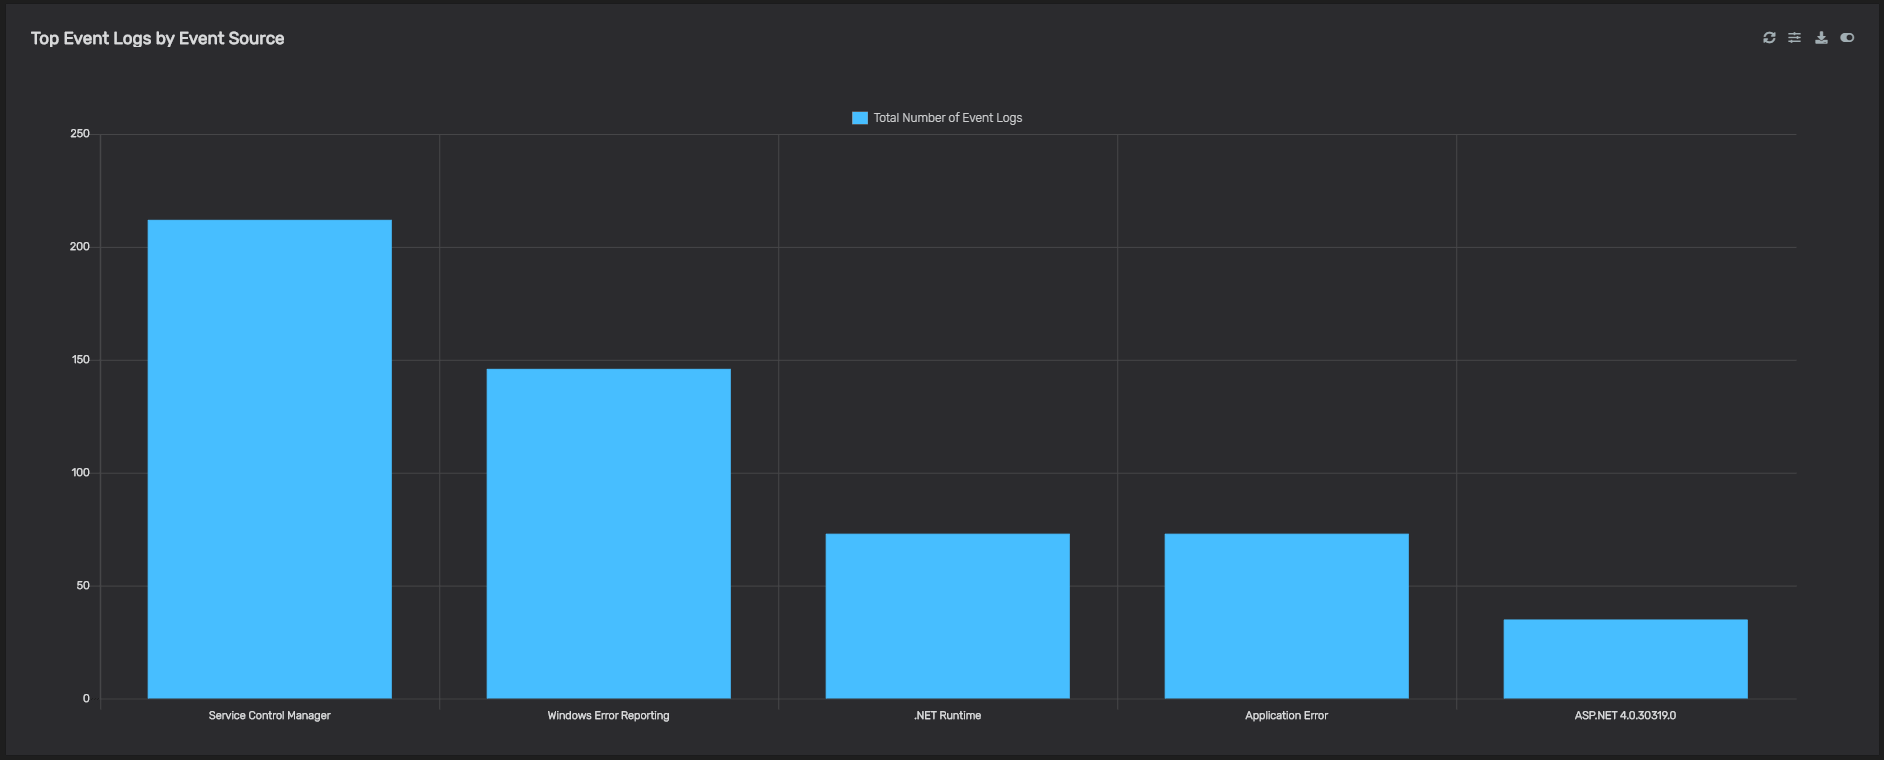
Event logs by source-Top Usage
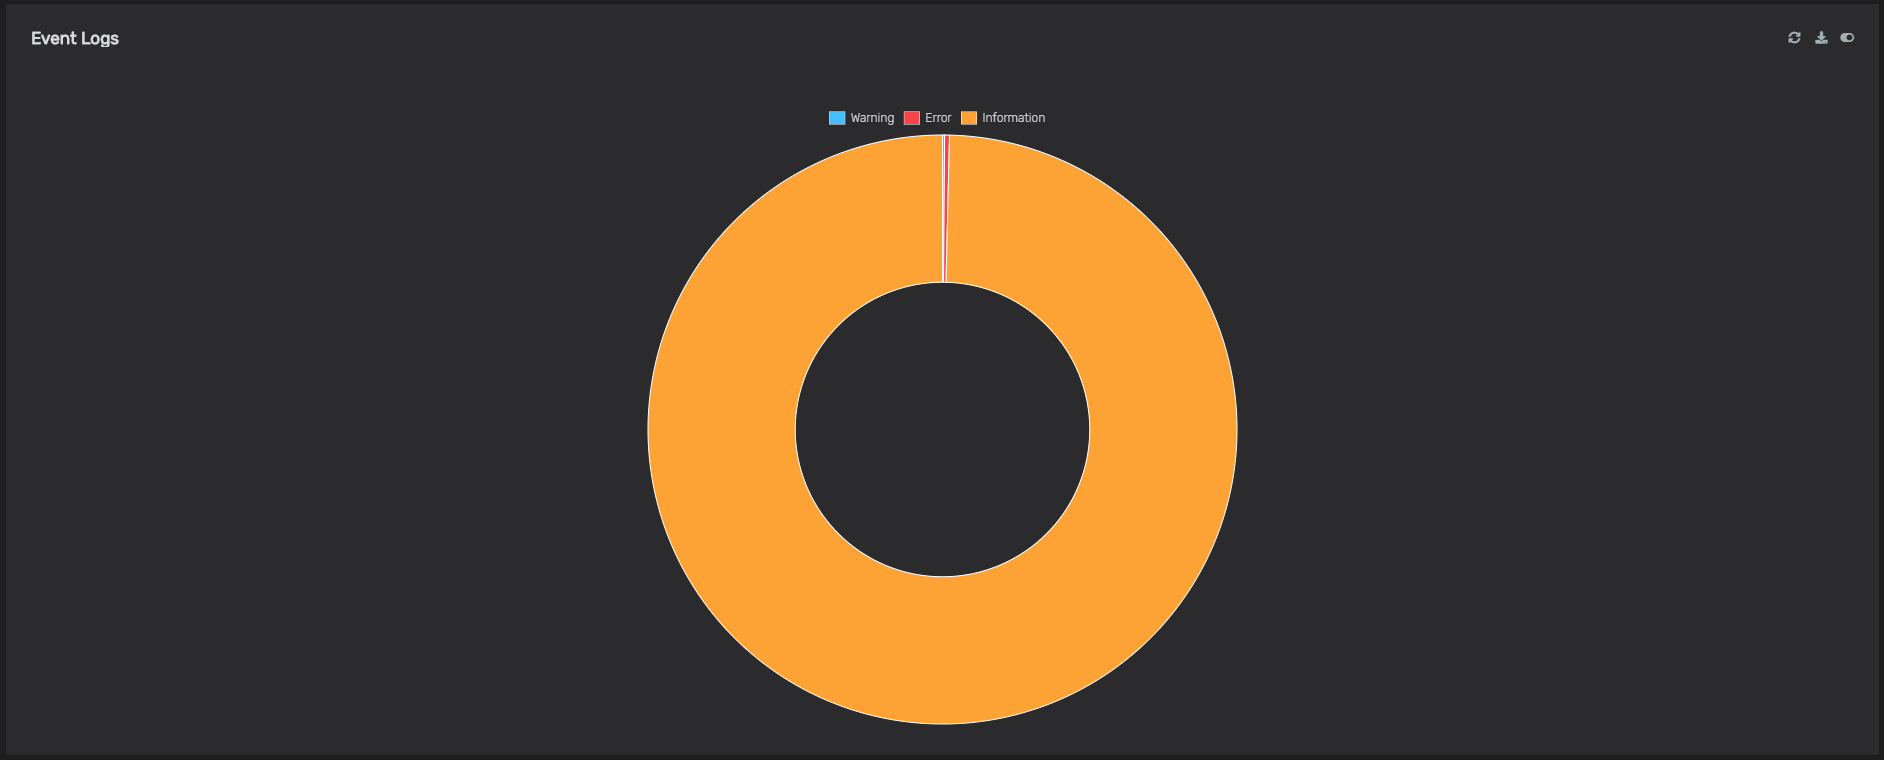
Event Logs - Doughnut Chart
Event Logs-Doughnut Chart - Security Filter
All the charts and views you need available in VirtualMetric Log Analyzer
Scanning manually thousands of lines of logs is easily leading to missing important data and correlation. VirtualMetric is transforming the tons of data into easy-to-understand charts. Thanks to our unique and advanced functionality we save you hours of work and provide you with full visibility into the processes within your servers and virtualization. Bu using our easy to customize charts you see abnormal trends in seconds. Manual reading of logs is tedious and painful. We make it a task, which you will love to do!
We make log data easy to use and understand
VirtualMetric Log Analysis and Log Monitoring tool was developed with the main thought to make log data meaningful and easy to understand and use by all engineers and IT experts. Administrators need better data representation in different graphical formats, charts, and reports. Gain intelligence and make fast decisions just by glancing at a simple report. Take timely actions.
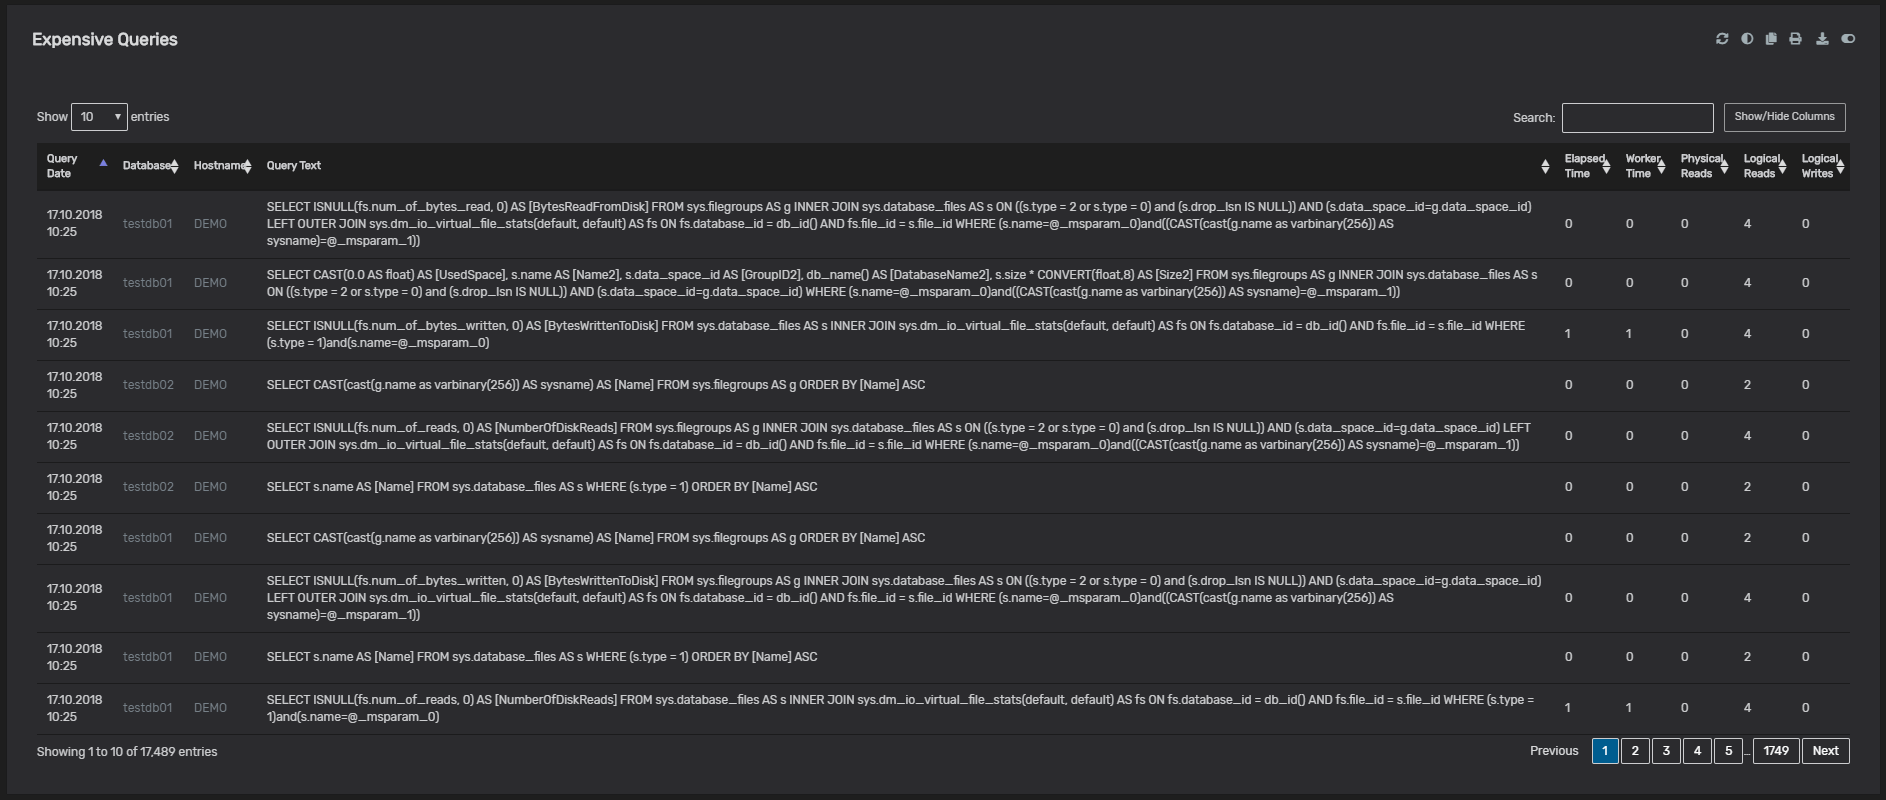
Expensive queries in a data table
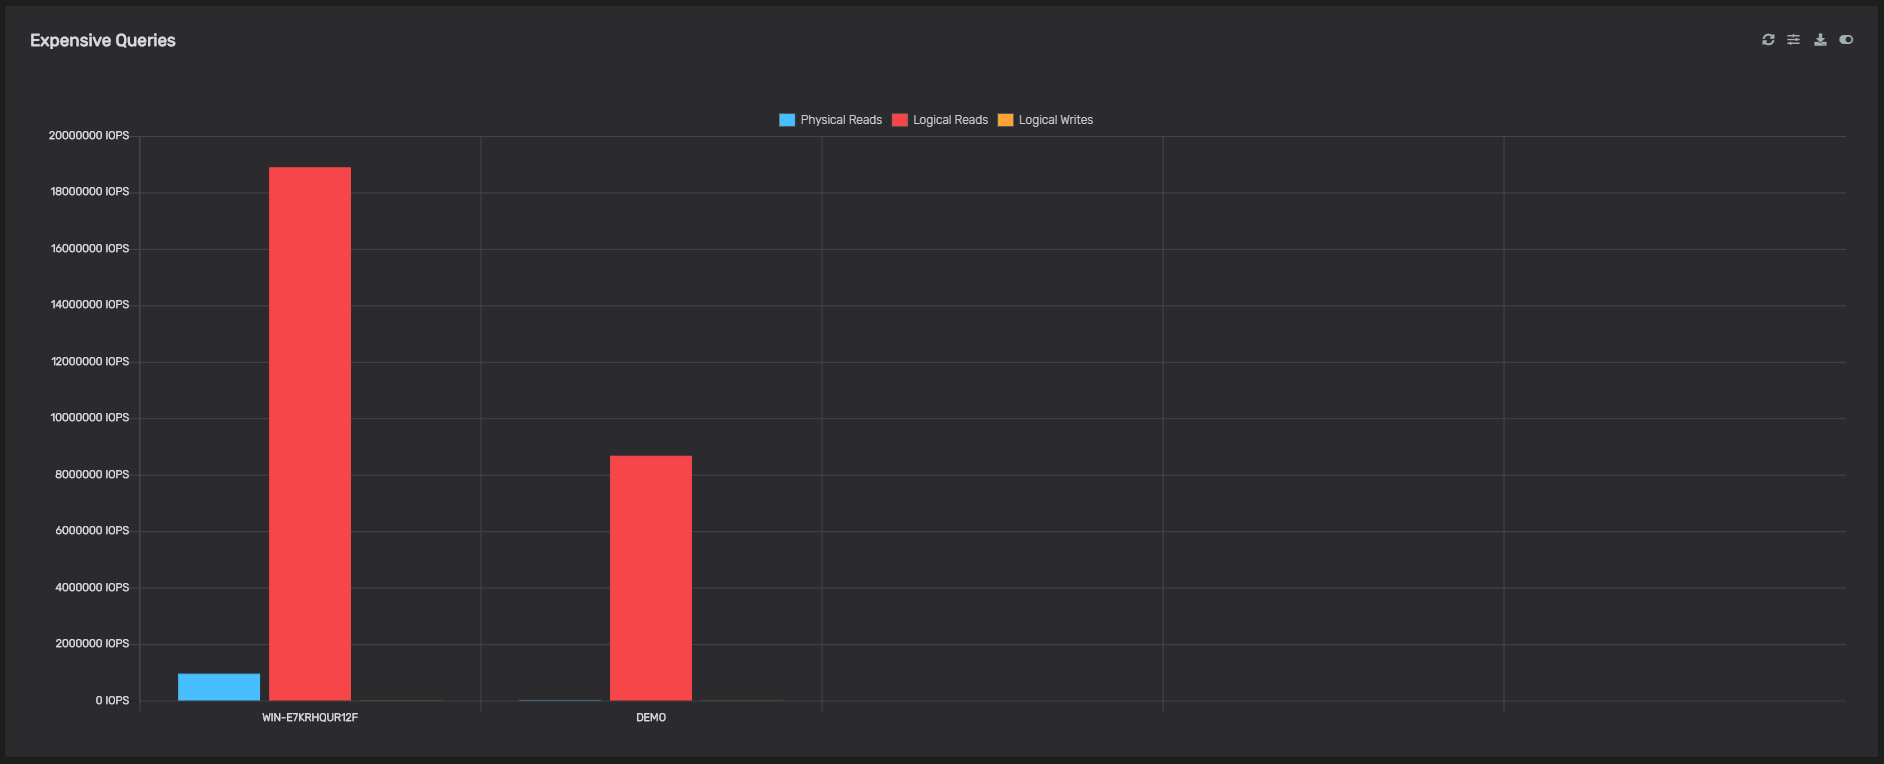
Expensive queries presented in a barchart
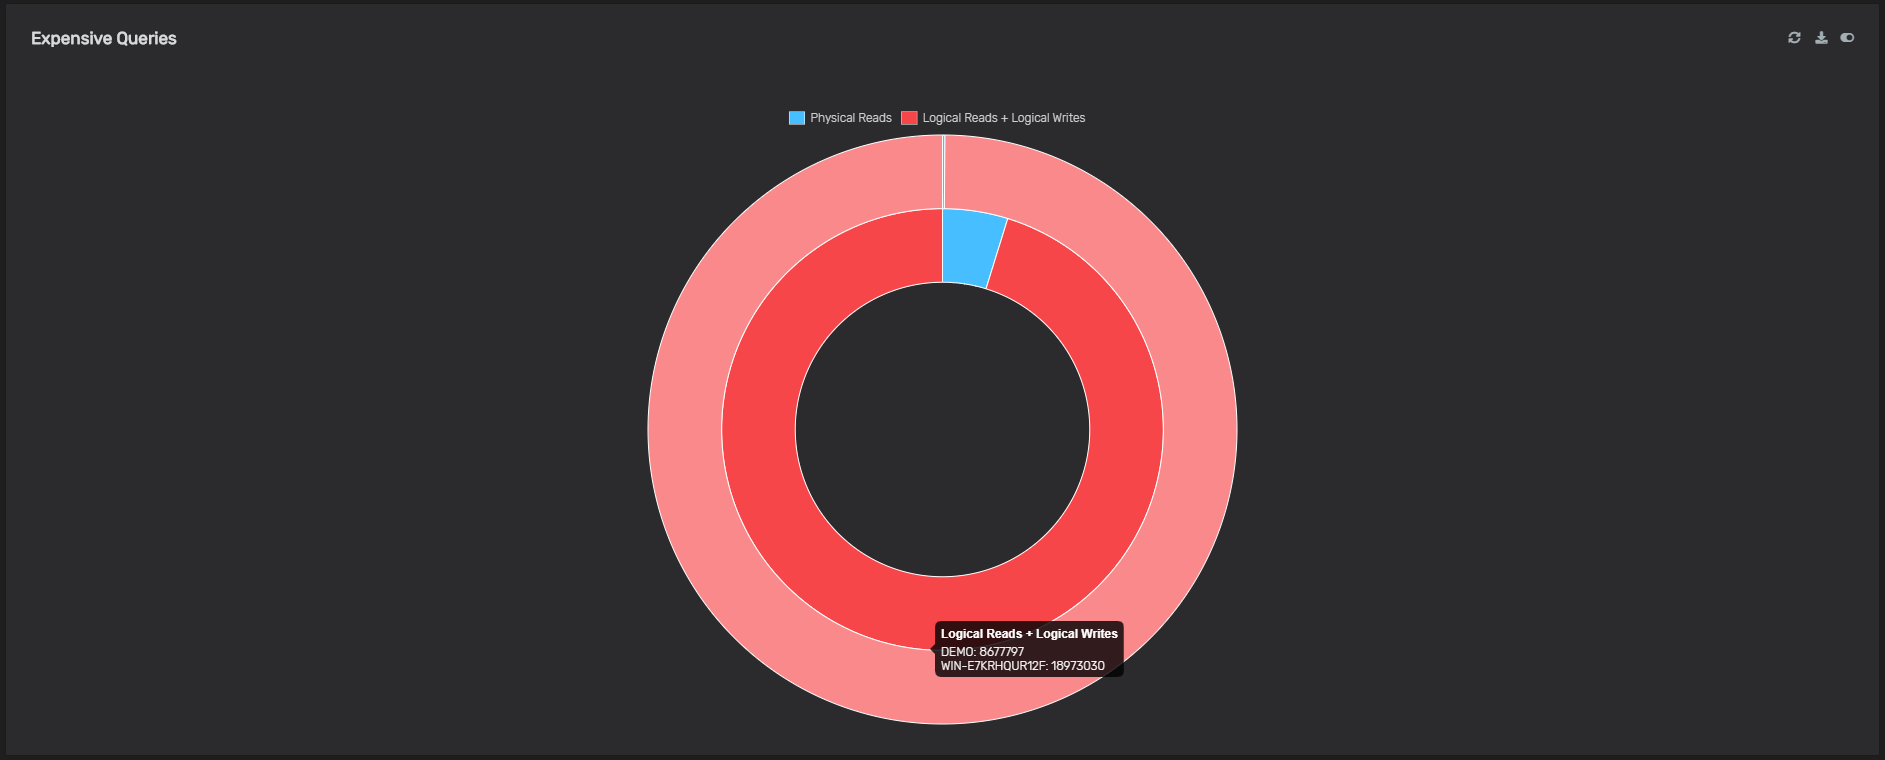
Expensive queries presented in a sum doughnut
Easily convert logs into beautiful charts
The Log Analyzer from VirtualMetric enables you to easily generate different types of charts based on the logs you want to analyze. For example, you can put occurred events on the line chart and you can monitor how the logs generated are changing by the time. This makes it easy to understand if there is an anomaly in a time frame.
As a next step, you can convert this line chart into the top chart, which makes it easier to top log sources. All administrators can realize which log source is generating the most event logs.
The disadvantages of other products are that when you are writing your own query if you need to change your chart type, you need to change the specific query type. This takes a lot of time and you need to be able to write very good queries. What we do at StorPool is that we know what you are trying to get when they choose “top chart”. We automatically change your request into the top chart query in the backend, so you don’t have to change anything in the REST query.
VirtualMetric Log Analyzer SIEM solution
The log analysis and log monitoring software, which is part of VirtualMetric’s Monitoring Suite, is among the most cost-effective Security Information and Event Management (SIEM) solutions. It meets all the needed SIEM capabilities – centralized log collection from heterogeneous sources, log forensics analysis, event correlation, real-time alerting and custom notifications available, log analysis, user activity monitoring, etc.
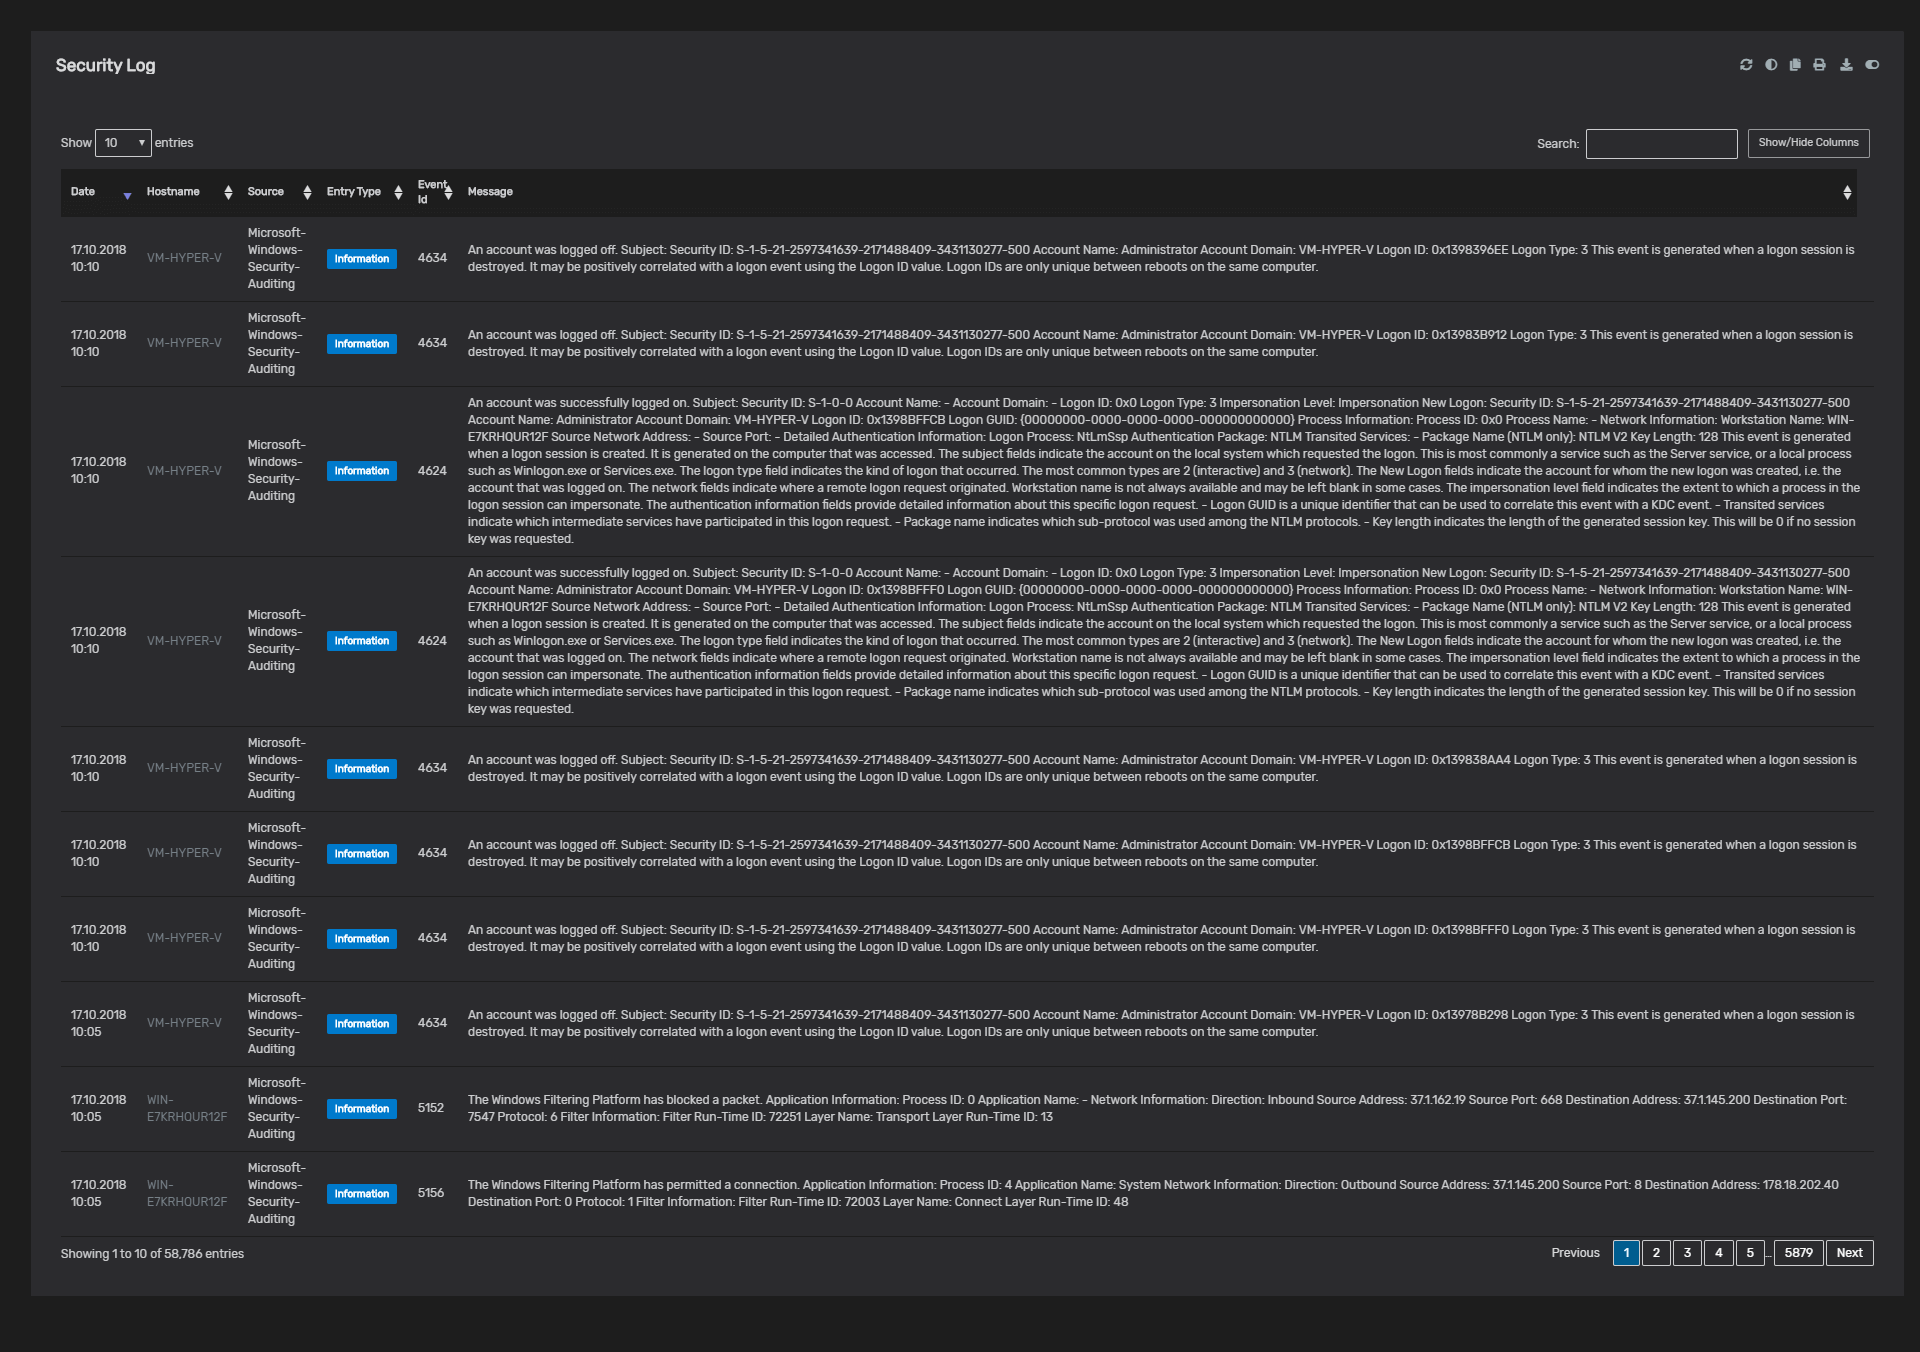
Security Logs Database
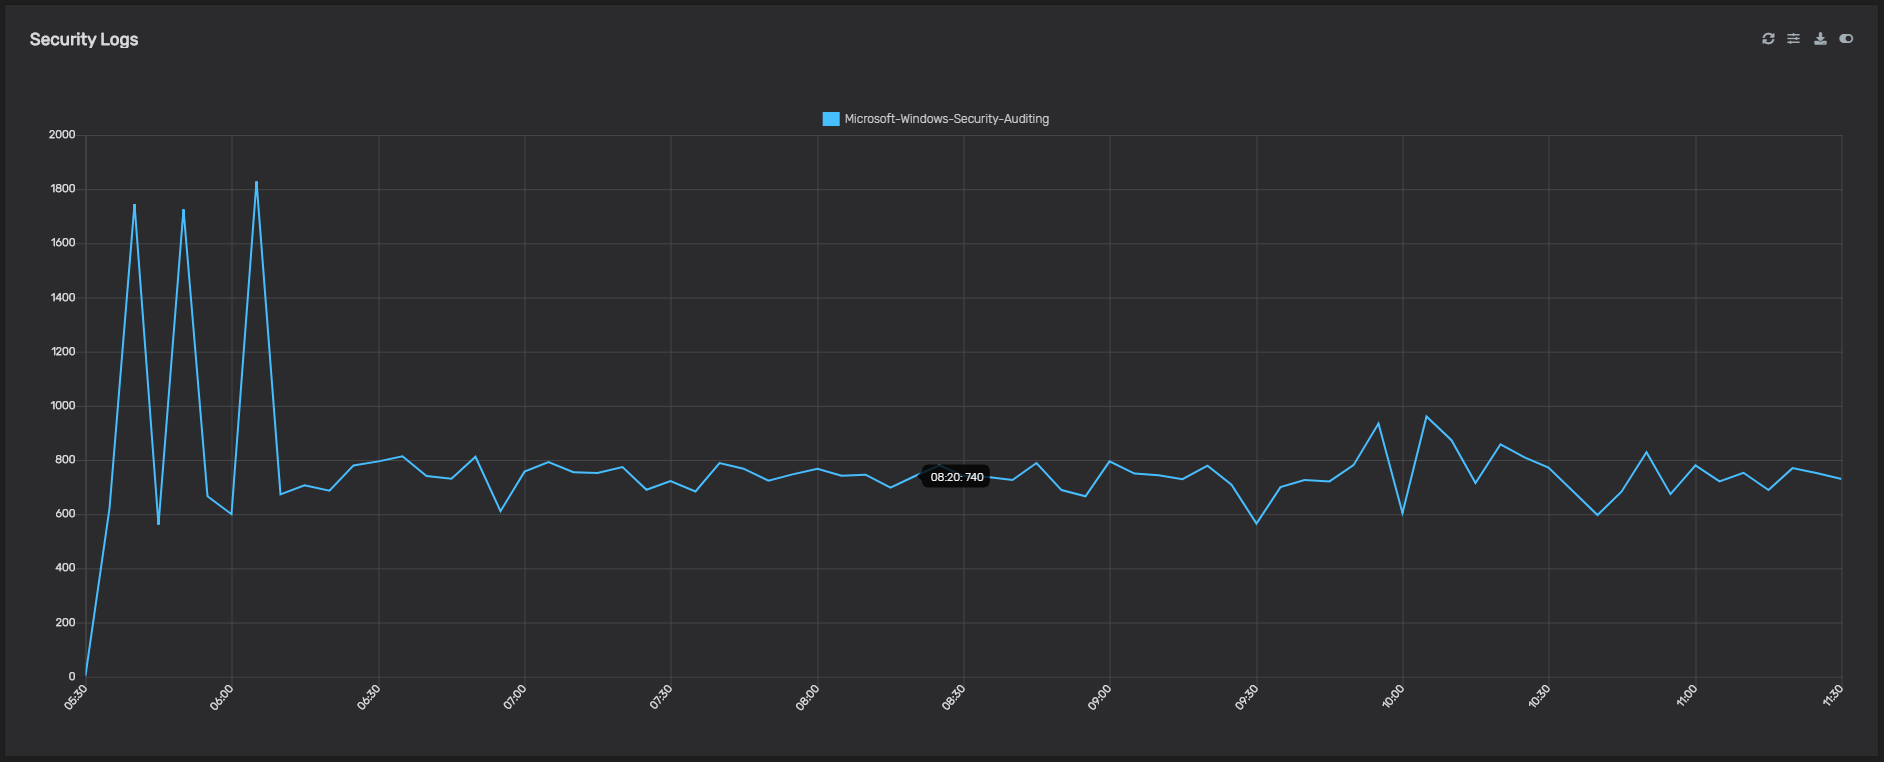
Security Logs visualized in a chart
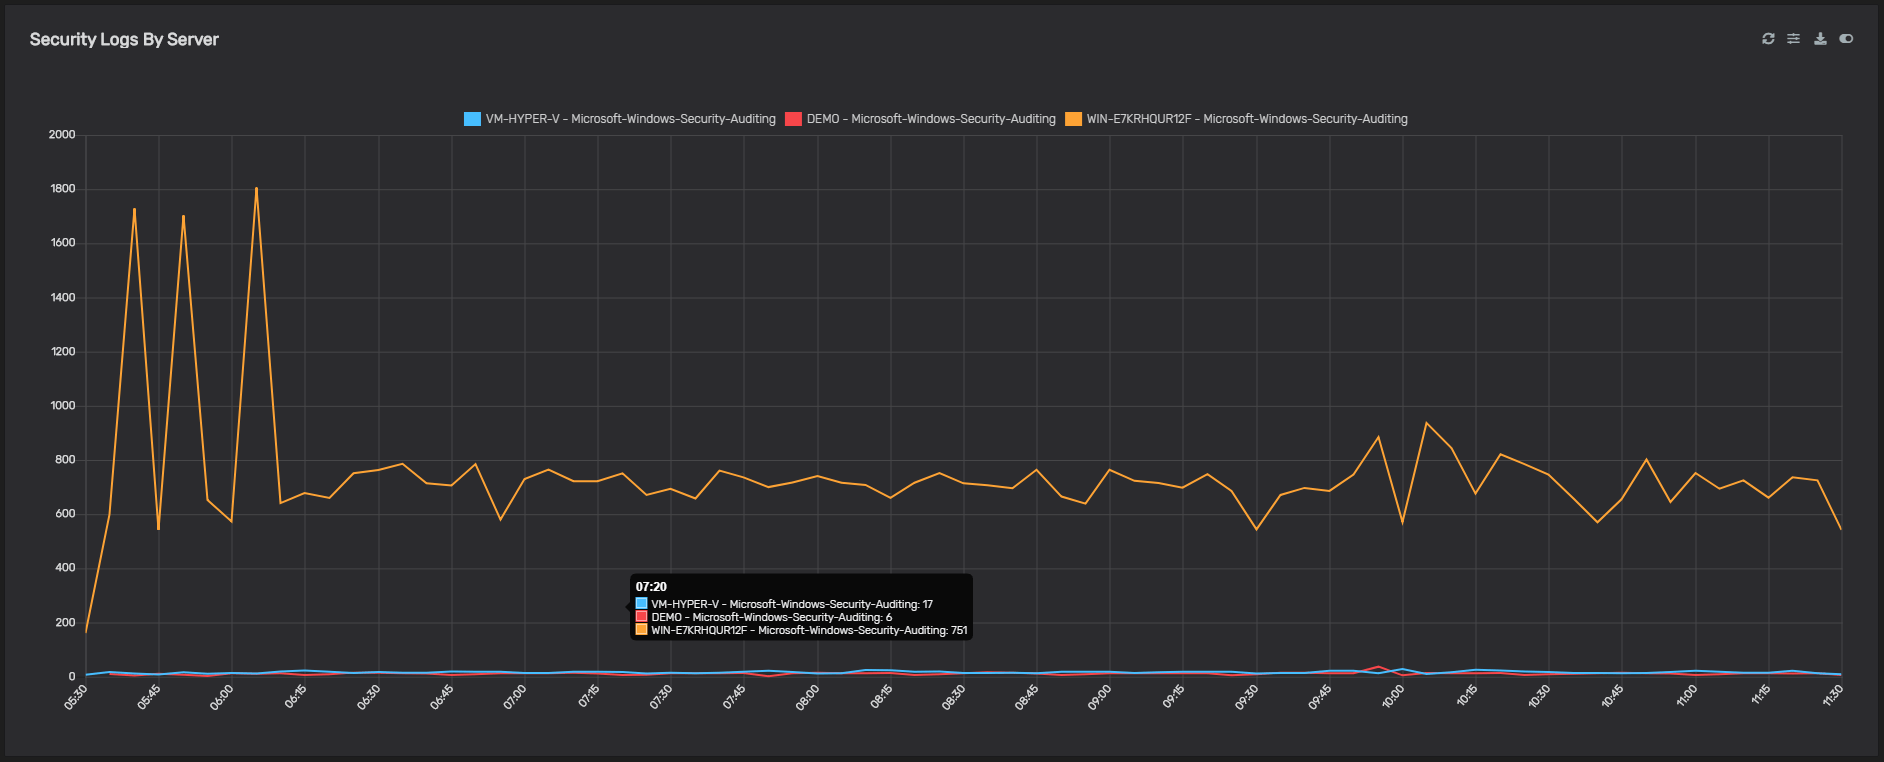
Security Logs by Server in a Chart
No complex queries and need to learn a new language
The usage of log analysis and log monitoring solutions on the market is complex and requires from you to be able to write complex SQL queries or to learn specific command in entirely new and custom for the solution language. With VirtualMetric you can focus on the simplicity and your main job. We do not require from you to have any development skills. The Log Analyzer is the easiest to use the solution on the market. Predefined event log and security charts are available to make it even easier.
Leave a Reply