
The challenge
The pressure on security teams keeps rising
Data volumes keep climbing
Every new endpoint, cloud service, and identity provider adds more telemetry. Your pipeline has to collect and process all of it, from every source, without falling behind.
Blind spots are where attacks hide
Data that’s never collected, dropped under load, or too inconsistent to correlate becomes a gap. And in roughly a third of intrusions, investigators can’t even determine the entry point because of logging gaps.
Attacks move faster
The window to detect an intrusion keeps shrinking, and AI now compresses it further. Exploit work that once took weeks can happen in hours. For the first time in over a decade, median dwell time is climbing again.
All of it comes back to one thing: how well your data pipeline performs.
Why pipeline performance became a security question
Pipeline performance used to be treated as plumbing until it broke. Now it decides three things that matter to every security team.
Can you keep up?
How fast your pipeline collects data decides whether you detect an attack while it’s still unfolding, or only discover it long after.
Can you cover everything?
How much your pipeline can handle decides whether you capture every source, or leave gaps where attacks slip through unseen.
Can you trust the data?
Whether data arrives clean and complete decides whether your detection rules and AI-assisted analysis actually work.
What we measured, and why each number matters
The benchmark tracks three metrics. Here’s what each one tells you in practice.
Events per second (EPS)
How much security data the pipeline can take in at once. When log volume spikes during an incident or a busy period, a pipeline with low EPS starts to fall behind — delayed or missing data exactly when you need it.
Throughput
How fast data moves from source to destination. Higher throughput means your SIEM sees events sooner — the difference between catching something in near-real-time and finding out hours later.
Correctness
Whether data arrives complete and consistent, not dropped or mangled along the way. The quiet one that matters most: detection rules and AI-assisted analysis only work on clean, consistent data.
Measure all three
Speed without correctness gives you fast, useless data. Correctness without speed gives you accurate data that arrives too late — the benchmark measures all three because security teams need them all.
The benchmark compares telemetry pipelines of all kinds, not only security ones. VirtualMetric is the security-built system in that field, measured against general-purpose tools on identical terms.
The Method
How the testing works
Every system runs the same test: identical data, the same hardware, the same pipeline shape. The tests recreate the situations that actually break pipelines in production: log files rotating, processes crashing and restarting, network connections dropping mid-stream.
- Same hardware for every system
- Loss recorded separately from speed
- Raw results published as auditable files
- Limitations documented openly

The results
Faster, cleaner, and complete – DataStream
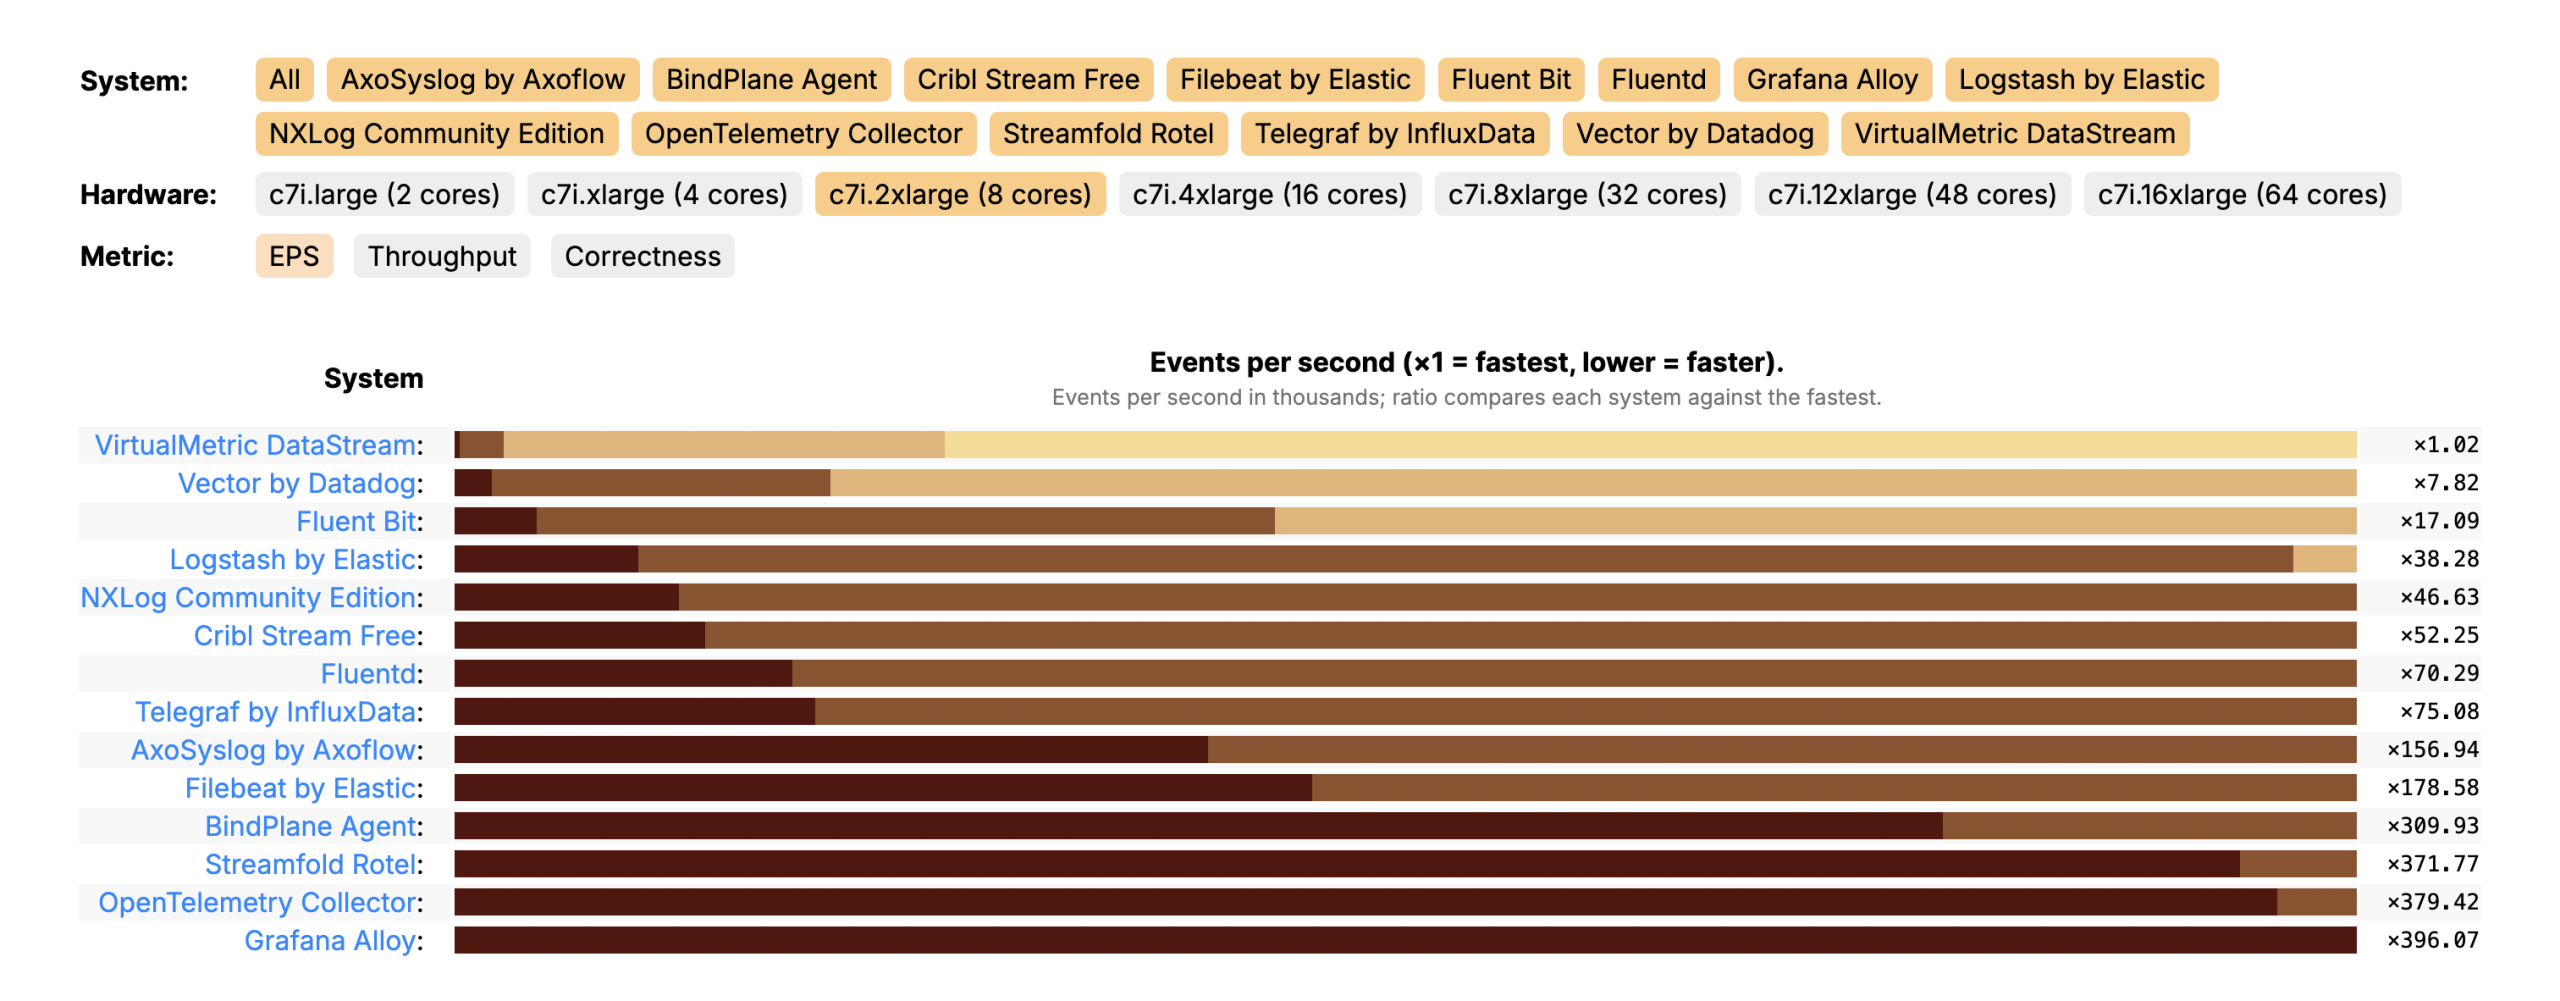
Every chart below comes from one hardware tier — c7i.2xlarge, 8 cores — so the comparison is like-for-like. Pick any metric, reproduce it yourself.
01 / Correctness
Data arrives intact, not mangled
Detection rules and AI-assisted analysis only work on clean data. VirtualMetric holds a perfect error rate while general-purpose tools distort or duplicate events at scale.
×1.00 error rate vs. up to ×7,128

02 / Throughput
More data through the same machine
Higher throughput means your SIEM sees events sooner — the difference between catching something in near-real-time and finding out hours later.
#1 throughput at 8 cores

03 / Events per second
Keeps up when volume spikes
When log volume surges during an incident, a low-EPS pipeline falls behind and drops data. VirtualMetric posts the highest sustained EPS in the test.
Highest EPS in test
The impact
What this means for your role
Frequently asked questions
You built this benchmark and you come out on top. Why should I trust it?
Fair question, any vendor-run benchmark deserves skepticism. That’s exactly why we made it open. The full methodology is published, the raw results are downloadable as auditable files, and anyone can reproduce the tests on the same hardware and code, or add their own system to the comparison. You don’t have to trust our summary, you can check the numbers yourself, or run them in your own environment.
Will I see the same results in my environment?
Results depend on your hardware, your data, and your configuration, so exact numbers will vary. The benchmark is designed to compare systems on equal footing rather than predict your specific throughput. The best way to know what you’ll get is to test on your own data — which is why we make that easy.
What was actually tested?
The benchmark recreates situations that break pipelines in production — log files rotating, processes crashing and restarting, network connections dropping mid-stream — not just clean, ideal conditions. Each system gets identical input on identical hardware, and what comes out the other end is counted and checked for completeness.
What do EPS, throughput, and correctness mean for my team?
EPS is how much data a pipeline takes in per second, throughput is how fast it moves data end to end, and correctness is whether that data arrives complete and intact. Together they decide whether you can keep up with your data, cover all your sources, and trust what reaches your SIEM.
Which systems are included?
The benchmark compares a range of well-known telemetry pipelines: VirtualMetric DataStream, Vector by Datadog, Fluent Bit, Logstash by Elastic, Cribl Stream (Free), AxoSyslog by Axoflow, and more. The list is public, and any pipeline can be added.
How often are the results updated?
The benchmark is a living project. Systems can be added or re-tested over time, and the methodology and results stay public so the comparison reflects current versions.
Talk to our experts
Book a technical session with our engineering team and see how DataStream performs against your current pipeline.
See it yourself
Run the benchmark yourself, or try DataStream on your own data and see the numbers in your environment.
Try now