A practical guide for IT professionals, DevOps, security teams, platform engineers, and anyone who’s dealing with logs.
In contemporary distributed systems, telemetry data—logs, metrics, traces, and events—serves as the primary mechanism for understanding internal system behavior. However, as system complexity increases, so does the volume and heterogeneity of telemetry. This raises a critical question: how do you manage, process, and route telemetry data in a scalable, reliable, and meaningful way? This is the role of a telemetry pipeline.
This article outlines the concept of telemetry pipelines, their architecture, common implementation strategies, and decision criteria for when and how to use them.
What Is a Telemetry Pipeline?
A telemetry pipeline is an architectural layer that manages the flow of telemetry data from distributed sources to one or more destinations like observability platforms, data lakes, security tools, or long-term storage.
Its primary function is not just to move data, but to shape and optimize it. The pipeline sits between the producers (e.g., cloud services, servers, containers, endpoints) and the consumers (e.g., monitoring tools, SIEMs, analytics platforms), acting as a system of control for how telemetry is collected, processed, and routed.
Instead of pushing raw, unfiltered data directly into backend systems, the pipeline performs operations such as:
- Normalization into structured formats
- Noise reduction by filtering irrelevant or redundant entries
- Enrichment with additional context or metadata
- Transformation to comply with schema or format expectations
- Redaction and masking to meet privacy and compliance requirements
Much like a refinery transforms crude oil into clean, usable fuel for vehicles, a telemetry pipeline takes in raw, unstructured data and refines it into a standardized, enriched form that other tools can consume effectively.
Why Is It a Distinct Architectural Layer?
Unlike log shippers or lightweight collectors, a telemetry pipeline is decoupled from specific tools or vendors. It typically lives within an organization’s environment—close to the source of the data—allowing greater control over processing, governance, and cost optimization.
A well-designed pipeline supports multiple data sources (cloud-native, legacy, hybrid), handles diverse formats (JSON, Syslog, XML, proprietary), and enables routing to multiple destinations—often with different processing requirements per target.
As the complexity of IT systems grows, telemetry pipelines are increasingly viewed not as a luxury, but as core infrastructure—supporting both operational visibility and security intelligence across large-scale environments.
Why Telemetry Pipelines Matter
Modern IT environments continuously generate large volumes of telemetry data from diverse and distributed systems. However, traditional ingestion architectures—where raw data is forwarded directly from sources to analytic platforms are increasingly unsustainable at scale.
Without a telemetry pipeline, organizations often encounter:
- Data overload: Raw telemetry is typically verbose and redundant, leading to excessive ingestion volume and rising storage and analysis costs.
- Format inconsistency: Different systems produce data in incompatible structures, complicating normalization and correlation.
- Operational complexity: Custom-built collectors and scripts increase maintenance burden and reduce reliability.
- Signal dilution: Valuable insights are often buried within irrelevant or low-value data.
- Limited flexibility: Adapting to new destinations or use cases requires manual reconfiguration.
A telemetry pipeline introduces a structured, scalable alternative. By intercepting telemetry at the edge, pipelines enable real-time filtering, transformation, enrichment, and conditional routing—before data reaches high-cost or latency-sensitive systems.
This shift in architecture offers several concrete benefits:
- Cost optimization: Only meaningful, formatted data reaches high-cost platforms.
- Compliance readiness: Redaction, masking, and structured routing help enforce data privacy policies.
- Operational clarity: Reduced noise makes it easier to identify true anomalies and respond to incidents.
- Infrastructure decoupling: Pipelines provide flexibility to change vendors or destinations without rebuilding collectors or integrations.
- Scalability: Centralized logic can be applied uniformly across sources, eliminating the need for duplicated configuration and reducing errors.
In short, telemetry pipelines are essential infrastructure for organizations seeking to control costs, reduce complexity, and improve the utility of their telemetry data at scale.
How a Telemetry Pipeline Works
At its core, a telemetry pipeline provides an end-to-end system for extracting value from machine-generated data. The pipeline architecture typically follows a three-stage model: data collection, data processing, and data routing. Each stage is responsible for a distinct function in managing the telemetry lifecycle—from ingesting raw events to delivering actionable, cost-optimized outputs.
1. Data Collection
This stage is responsible for gathering telemetry from disparate systems. Sources can include application servers, network infrastructure, cloud environments, databases, containers, and endpoint devices. Two primary methods are commonly used:
Agent-Based Collection
Agent-based collection relies on lightweight software components installed directly on the source systems. This approach offers deep integration with the host, granting access to rich local telemetry and enabling real-time event streaming. However, it comes with certain trade-offs. Installing and maintaining agents requires ongoing operational effort, particularly in large-scale environments, and can introduce additional system overhead. As a result, while agent-based methods deliver high-fidelity data, they can be resource-intensive to deploy and manage at scale.
Agentless Collection
Agentless collection uses built-in system protocols such as SSH, WinRM, Syslog, or REST APIs to gather logs remotely, without installing software on the source machines. This approach simplifies deployment, as there is no local footprint to manage, and allows for centralized control, making it easier to scale across many systems. However, it requires secure handling of credentials to protect access channels, and it may provide only partial visibility compared to on-host agents.
Despite the limitations, agentless methods are increasingly favored, particularly in regulated or high-complexity environments, where minimizing surface area and operational burden is critical.
2. Data Processing
Once data is ingested, it must be shaped—structured, normalized, and cleansed—to be useful and cost-effective. This is often the most resource-intensive part of the pipeline and includes a range of transformations:
- Parsing: Converting unstructured logs into structured formats like JSON or key-value pairs
- Normalization: Standardizing data formats across heterogeneous sources
- Filtering: Removing irrelevant or duplicate events (e.g., routine health checks, verbose system logs)
- Enrichment: Adding context such as geo-IP data, asset tags, cloud region, or source classification
- Sampling: Reducing high-volume data by selecting representative subsets
- Redaction & Masking: Stripping or obfuscating sensitive fields (e.g., PII, tokens) for compliance
- Deduplication: Identifying and removing repeated log entries
Processing allows teams to optimize for performance, cost, compliance, and usability before telemetry reaches downstream systems.
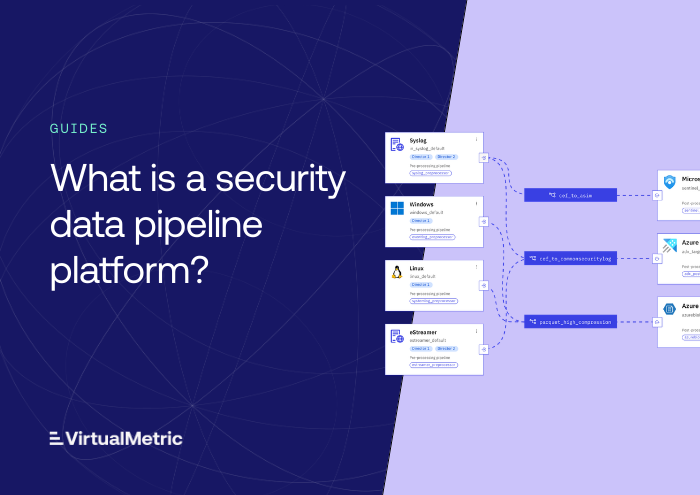
3. Data Routing
The final stage is delivery. Based on business logic, metadata, or content tags, the pipeline decides where to send each log, trace, or metric. Routing can be conditional, multi-target, and content-aware:
- Security logs → SIEM or XDR
- Application telemetry → Observability platforms
- Audit logs → Long-term blob or object storage
- High-volume, low-frequency data → Cold storage (e.g., S3, Data Lake)
- Metrics → Prometheus, InfluxDB, or time-series databases
Routing decisions are essential for aligning telemetry with use case demands—real-time alerting, compliance retention, or historical analytics. A modern pipeline can fork outputs, replay data, or enrich for one tool while downsampling for another—enabling flexible data handling across heterogeneous environments.
Optional Stages: Monitoring & Governance
Mature telemetry pipelines often include components for self-observation and access control:
- Pipeline Monitoring:
- Throughput metrics (ingress/egress)
- Latency tracking
- Error rate analysis
- CPU and memory usage per component
- Governance & Security:
- Role-Based Access Control (RBAC)
- Configuration versioning and audit logs
- Secure credential management (e.g., via Managed Identity)
These capabilities are crucial to ensuring stability, compliance, and accountability—particularly in enterprise or multi-tenant deployments.
Why Use a Telemetry Pipeline
Telemetry pipelines offer a structured way to manage complexity, reducing operational overhead while improving the utility, cost-efficiency, and compliance of telemetry data across environments.
Core Use Cases
1. Security Operations
Security teams use telemetry pipelines to pre-process logs before forwarding them to SIEMs or XDR platforms. This improves signal fidelity while reducing ingestion volume—and therefore cost. Preprocessing may include normalization (e.g., ASIM, OCSF), deduplication, enrichment (e.g., threat intelligence or geo-IP), and masking of sensitive fields.
2. Observability and Monitoring
For DevOps and SREs, telemetry pipelines enable real-time visibility by standardizing data across diverse sources. This includes transforming unstructured logs into structured formats, extracting metrics from high-volume logs, or shaping logs for dashboards, alerts, and diagnostics.
3. Compliance and Governance
Organizations bound by data protection regulations (e.g., GDPR, HIPAA, CCPA) use telemetry pipelines to enforce data residency, classify sensitive data, and redact PII or PHI before data leaves their perimeter. Pipelines also facilitate long-term retention strategies by routing logs to immutable storage.
4. Infrastructure and Application Performance
By cleaning and enriching logs, pipelines help engineers identify performance bottlenecks, trace failure events, and correlate signals across distributed systems—essential for debugging and historical analysis.
Final Thoughts
Telemetry pipelines offer a structured, scalable way to manage operational and security data in modern infrastructure. By enabling selective collection, structured processing, and intelligent routing, they reduce system complexity, control costs, and enhance the value of telemetry data.
While smaller or less complex environments may manage without one, pipelines become critical as telemetry grows in volume, diversity, and strategic importance.
For organizations routing security telemetry to SIEM, VirtualMetric DataStream provides full pipeline functionality during the free trial with up to 500 GB/day of ingest, helping you get maximum insight from your data while keeping costs under control.
Read also: What is Telemetry Data?, Telemetry in Cybersecurity: Your Complete Guide to Data-Driven Security
analysts say
-
“By 2026, 40% of logs will go through a telemetry pipeline, up from less than 10% in 2022.”
Gartner
-
“If You’re Not Using Data Pipeline Management For Security And IT, You Need To.”
Forrester
See VirtualMetric in action

Start your free trial to experience safer, smarter data routing with full visibility and control.